Tornado

A tornado is most commonly defined as violently rotating column of air within the updraft region of thunderstorms. Tornadoes are usually sighted as a funnel or cone-like shape trailed by a cloud of dust and debris close to the ground. They generally occur near the trailing edge or end of a thunderstorm. These systems can follow tropical storms and hurricanes as well as they move inland. Tornadoes occur when cool air from a storm converges with the warm air, causing the warm air to rise and from the shape of a funnel. Peak tornado season ranges from March-May in the majority of southern states usually occurring between the hours of 3PM and 9PM. However, tornadoes can occur during any month of the year and at most any time during the day.
Tornado Classification
The Fujita-Pearson Tornado Measurement Scale measures the magnitude of a tornado by the seriousness of the damage caused and the strength of the wind speed produced during the tornado. The scale was originally developed by a
University of Chicago storms research scientist Dr. Ted Fujita. At the time of development, there was no way to accurately measure wind speed, so Dr. Fujita developed a scale where approximations can be made based on the amount
of damage done. The scale rates tornadoes based on damage done to an individual structure on a scale ranging from F0 (little damage) to F5 (blown away). After the Fujita Scale rose to prominence, many scientists and engineers
noted that the scale had several weaknesses because it did not recognize difference in construction and it overestimated wind speeds greater than an F3.
The Enhanced Fujita (EF) Scale was thus developed by meteorologists and engineers to expand and improve upon the work done by Dr. Fujita based on years of observation. The table information includes wind speed and description
of damage done for each rating on the EF scale.
EF-O: Wind Speed of 65-85mph; Light damage. Peels surface off some roofs; some damage to gutters or siding; branches broken off trees; shallow-rooted trees pushed over.
EF-1: Wind Speed of 86-110mph; Moderate damage. Roofs severely stripped; mobile homes overturned or badly damaged; loss of exterior doors; windows and other glass broken.
EF-2: Wind Speed of 111-135mph; Considerable damage. Roofs torn off well-constructed houses; foundations of frame homes shifted; mobile homes completely destroyed; large trees snapped or uprooted; light-object
missiles generated; cars lifted off ground.
EF-3: Wind Speed of 136-165mph; Severe damage. Entire stories of well-constructed houses destroyed; severe damage to large buildings such as shopping malls; trains overturned; trees debarked; heavy cars
lifted off the ground and thrown; structures with weak foundations blown away some distance
EF-4: Wind Speed of 166-200mph; Devastating damage. Whole frame houses and well-constructed houses completely leveled; cards thrown and small missiles generated.
EF-5: Wind Speed of over 200mph; Incredible damage. Strong frame houses leveled off foundations and swept away; automobile-sized missiles fly through the air in excess of 100 m (109 yards); high-rise buildings have significant structural deformation; incredible phenomena will occur.
Extent, Past Events, & Location
Between 2000 and 2021, the BRADD Region received — FEMA Disaster Declarations that included tornados:
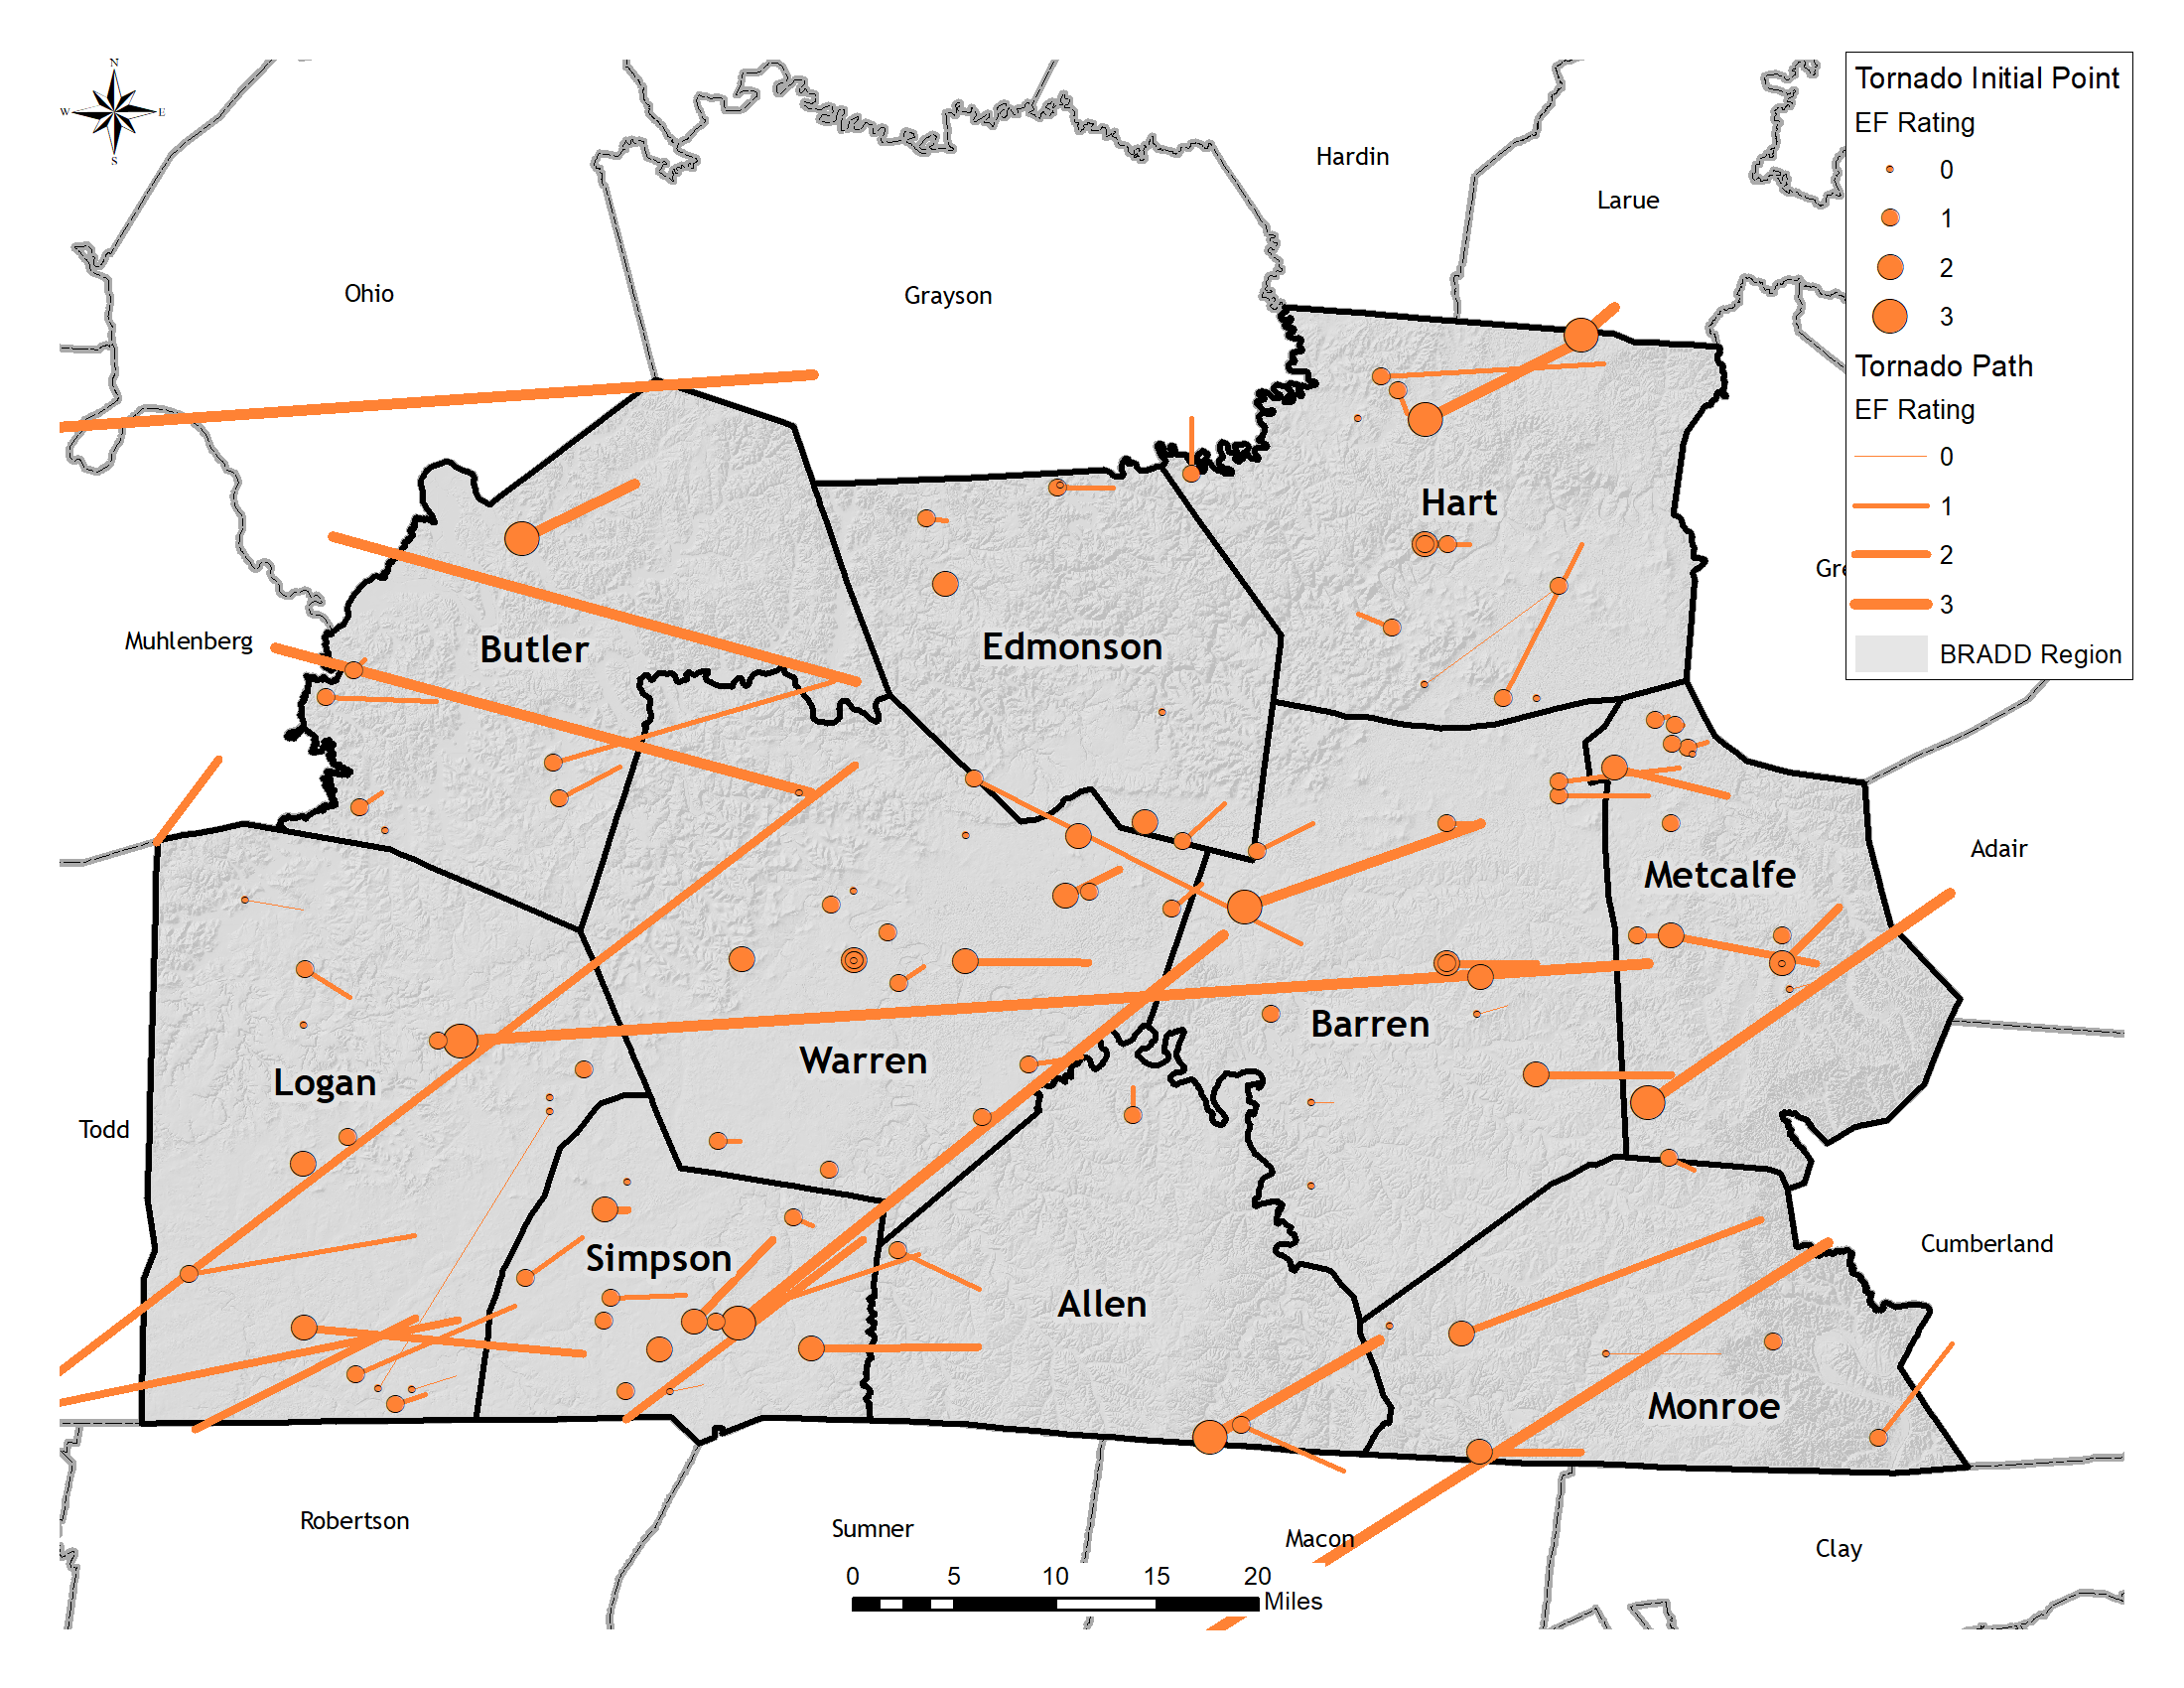
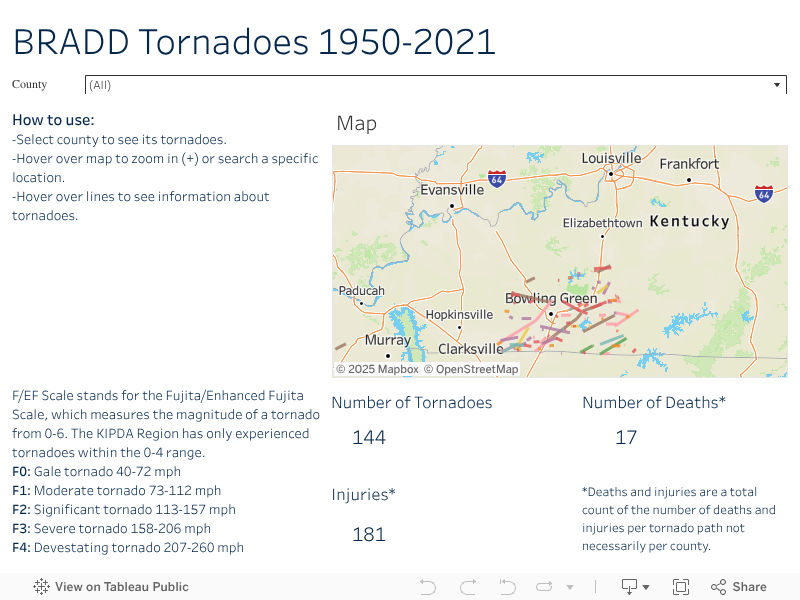
The map below covers tornados that happened in the region from 1950-2020. While not each of these events received a FEMA declaration, each qualified as a tornado.
Historical Occurrences
In December 2021 and January 2022, the BRADD region experienced multiple tornados of record. A summary of those events and how they impacted jurisdictions in the BRADD region is below.
December 10-11 Tornadoes
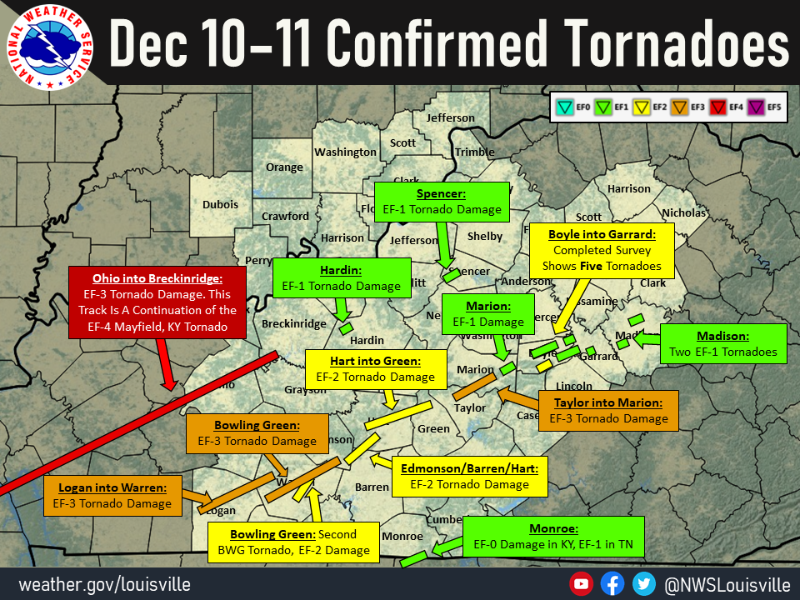
A potent storm system moved across the central United States on December 10-11, 2021 resulting in widespread severe weather. Numerous tornadoes occurred with storms that traveled through Kentucky Friday evening into Saturday morning (Dec 10-11) including a significant long track tornado that devastated Mayfield, KY. This tornado began near Woodland Mills, Tennessee, and stayed on the ground all the way to Falls of Rough, Kentucky; a distance of 165.7 miles ( weather.gov).
The supercell that had cycled down its tornado in eastern Todd County (but continued to produce wind damage northeast of Elkton) spun back up again soon after crossing the border into western Logan County. It quickly ramped up to EF-3 (140 mph) intensity with a damage swath roughly three quarters of a mile wide along Milton Sharp Rd. On the southern side, a family was home when a 2 by 4 narrowly missed the husband as the roof was being peeled off the middle of the house. On the north side, a large dairy farm was completely destroyed.
As the tornado continued northeast, a wide swath of trees was snapped/uprooted along the edge of a forest on the southern edge of the vortex, while on the north edge a well built home had its second floor two-thirds thrown off. A male was in the other section when a 2 by 4 from the first floor came up and got lodged in his mattress. Another well built log cabin in this area lost its second floor roof.
The tornado then turned more ENE in the Buena Vista Rd area. A doublewide manufactured home was completely destroyed here along with several outbuildings on the property. A male at the home received warning from family and heard the tornado approach, getting into a bath tub in the middle of the east side of the structure. After it hit, the home blew into a row of trees and the male remembers grabbing onto a tree southeast of his original location. He sustained injuries as medics had to get wood out of his legs. The tornado continued over to Lakewood Ln where a boy was in the second story of a house when the window imploded inward and moved the bed he was in.
After this, the storm crossed US 431, impacting several trees along Hwy 1040 with EF1 level winds. It then moved to a row of mobile homes along H.C. Johnson Rd. Two of these homes were completely destroyed, with one blown into a row of trees south of its original point and another lifted up and over a tree just east of its original location. This may have been a mesovortex spinning around the main circulation. The tornado damage was widest at this location, roughly 0.8 mile. On the south side of the tornado, a mobile home was completely destroyed along Hwy 915 where it was spread out over the road. The resident was a female whose father insisted she stay the night at his place, with a basement, after hearing the messaging in the days before.
That same mesovortex may have been what caused the collapse of an electric transmission line just east of Marshall Rd where there was little damage to surrounding trees. Farther north on that road a well built brick home had its roof taken off as well as the carport removed. The tornado continued to track along Hwy 79 towards the Chandlers Chapel area where the Methodist Church lost its steeple and had damage to several of the stained glass windows. A couple of homes had major damage here. A resident said he had at least 20 minutes of warning lead time ahead of the touchdown. There was additional damage along Turner Road and then 3 Poplars Rd.
This survey ended soon after 3 Poplars Rd. Another survey was conducted in the far northeast corner of Logan County where a couple of long chicken barns were leveled. Aerial damage surveys also indicated a damage swath that extended into western Warren County for a few miles.
The National Weather Service in Louisville surveyed a tornadic supercell over the course of 6 days in Warren County which directly struck Bowling Green. The tornado first touched down in rural southwestern Warren County just south of the intersection of Wimpee Smith Road and Petros Browning Rd. This consisted of twisted, snapped, topped and uprooted softwood and hardwood trees. The tornado was about 200 yards wide, with EF1 winds of 90 mph. Aerial photography confirmed the tornado was continuous in this rugged area of southwest Warren County.
The tornado increased to EF2, between 120 and 125 mph, doing major damage to several older barns along Tommy Smith Road. It threw a 1700 pound cattle trailer, 300 yards into a creek ravine.The NWS drone showed a distinct narrow main funnel within the larger funnel. This 30 to 35 yard funnel was clearly seen scouring the corn field and produced the most concentrated damage. The narrow funnel crossed Browning Rd and hit a well constructed house. The only major part of the house that survived was an interior bathroom and hallway. Winds were estimated at 135 mph, and areas outside the narrow funnel had damage of 100 mph, and the entire overall width was 250 yards wide.
The survey team found extensive tree damage along Van Meter Rd and Fuqua Rd and aerial photography confirmed the tornado was continuous in this rugged, mainly forested area. The tornado did minor roof damage to some homes along Blue Level Road of 86 to 90 mph but did more substantial roof and side damage to several barns, of 90 to 95 mph. Based on drone technology, there appeared to be two distinct areas of damage, and likely had a smaller satellite tornado. There was extensive roof damage to the Zomi Agape fellowship center with insulation thrown both downwind and on the upwind side of the building. The tornado increased in speed when it was over Old Tramm Rd by Rembrandt Court and Powell Road. One house on Rembrandt Court was knocked out its foundation by the garage attachment and slid about 15 feet. Other homes were knocked down to just interior bathroom and hallway remaining, but there were some foundation construction concerns. EF2 winds of 130 to 135 mph were evidenced in this area.
Several houses were knocked down to the foundation, but there was some foundation construction concerns. In addition, farm equipment from a barn on the right side of Powell St was thrown directly into homes on the left side of Powell Rd. The survey team found significant house damage to dozens of homes in the Creekwood subdivision. This included exterior walls collapsed, roofs blown off, foundations severely compromised, garages blown in, insulation blown on all four sides of houses, and garages severely damaged or destroyed. In fact, they were dozens of double garages damaged, where one garage door blew in and the other garage door blew out. There were hundreds of powerlines and snapped power poles down throughout the county. Trees were uprooted snapped and twisted facing in all directions. Dozens of cars were flipped, twisted, turned, and thrown into homes. There was clear evidence of 2 x 4 thrown into the ground, like missiles. Several splintered boards were impaled into vehicle windshields, tires, and along the hood grills. Most of the damage was rated EF2 from 115 to 135 mph except for 8 homes near Mossy Creek.
The survey team brought in engineers from WKU to look at 8 homes, which were wiped down to the foundation from Moss Creek to Mossy Stone. Engineers helped in determining winds speeds were 160 mph for these houses, a high EF3 rating. Tragically, several fatalities occurred in the subdivision area.
The tornado was 250 yards wide in Creekwood, but increased to about 350 yards wide before crossing Veterans Parkway. The tornado crossed the William Natcher Parkway and hit large townhouses along Veterans Parkway. There was numerous windows shattered and some roof damage. One of the town houses was shifted off the foundation, but there were no bricks or other support on it. The tornado crossed Russellville Rd hitting many business. At Royal Motor Cars, several storage buildings were destroyed, major loss of roof panels at Cabreras Mexican restaurant and an auto parts store. At Plumbers Supply company at 2321 Russellville Rd. The garage was blown in and collapsed. The main building had a shifted foundation, and a partial collapse of some exterior cinderblock walls, tractors and trailers were twisted and flipped, and there were numerous power poles snapped. The Shell gas station had major damage to service station canopy and store, as well as walls of an Enterprise car rental.
The tornado increased to quarter mile wide and went from EF2 of 130 mph, from Royal Motorcars to AutoZone, and then decreased to EF2, 115-120 mph and narrowed to 1/8th of a mile with major tree and roof damage along Lealand Street, Cedar Ridge, and University Drive. A fully loaded dumpster was thrown 250 yards. At Russell Road and Springhill Avenue, a Marathon gas station had its pumps destroyed, and most of the exterior walls was destroyed. The tornado missed Western Kentucky University by 225 yards, but debris was thrown all over the campus including some impaled debris into buildings.
The tornado went along 31W including doing significant damage to roof at Bobas lounge, a liquor store, and a smoke shop. This was estimated to be 110 to 120 mph, and tornado width decreased to 250 yards by Walgreens and Taco Bell. The tornado, appeared to be slightly elevated, doing mainly tree damage, power poles, and house roofing and siding along Magnolia Ave and Nutwood St. It crossed Lehman, went along Covington, with wind speeds mainly of 95 to 110 mph. The owner 708 Nutwood said, the warning saved thier lives, as the house was violently shaking, but they sought shelter and lived.
Much of the tree damage was facing from the northeast to the northwest. The tornado paralleled Cemetery Rd doing roof and gutter damage along with power lines and tree damage. The tornado’s speed and winds increased along Cherokee Dr. with roofs removed and large healthy hardwood trees uprooted. The width increased to 300 yards and speeds to 105 mph with width of 225 yards. The narrow 175 yard funnel, hit the Indian Hills golf course, twisting, snapping, and topping numerous pines and cedars with winds speeds of 86 to 90 mph.
The tornado then crossed the Barren River and increased in speed along Old Porter Pike to EF2, between 111 and 120 mph. Huge diameter hardwood trees were snapped and uprooted, including several very tall oak trees. There was also extensive roof damage to some well built homes. It weakened as it approached exit 28, doing EF1 damage of 90-95 mph to Hucks gas station and damaged a very tall Wendys sign. On the north side of 31 W, a fully loaded 18 wheeler facing west, was knocked over and was dragged 15 yards to a northwesterly directly. Winds were increased to EF2, of 115 mph.
At the Corvette plant there was significant roof damage, with metal sheeting, insulation, HVAC units, and other debris thrown hundreds of yards downwind. Light poles in the parking lot were snapped, One of the security checkpoints at the Corvette plant was totally destroyed with large sections of the building being thrown several hundred yards, and weighing over 100 pounds, striking several vehicles. Winds were mainly in the 110 to 120 mph range.
The tornado continued to parallel I 65, just west of the interstate. It struck several homes at Bristow Rd and Friendship Rd. Most of the damage was done to roofs siding and gutters and destroyed a well- built greenhouse. Numerous power poles and lines were down and the debris pattern was facing from southeasterly, all the way to northwesterly. There was some barn and tree damage near Kelly Road and the CSX railroad crossing. Winds were 85 to 90 mph and width of 200 yards.
The tornado really increased across the TransPark at Exit 30. A few metal building structures at the peak intensity of the tornado sustained heavy damage. The middle building totally collapsed. Analysis showed that building was well constructed, but the shearing force from the intense tornado ripped the metal frame from the anchoring plates of the building. Analysis of the third building showed the tornado had weakened some at this point, down to EF2 levels. The WSR-8D showed a Tornadic Debris Signature downstream of this area, which was was lofted to around 18 kft, right at the high end of EF3 of 165 mph. The tornado weakened further downstream as it caused roofing and siding damage to several structures and tree damage into southeast Edmonson County. Civil Air Patrol imagery helped identify the end point of this tornado.
The National Weather Service conducted a storm damage survey over several days across Warren County from the historic December severe weather event of Saturday, December 11, 2021. After an in-depth radar analysis and on-the-ground surveying, the survey team found a separate tornado which first touched down as a thin skipping tornado just before the Bowling Green-Warren County Regional Airport. It damaged a storage building, and then became more ground based on the east side of the airport, damaging the roof of a well built hangar. The Bowling Green ASOS measured a 63 mph wind gust about a quarter mile away from the 100 yard wide tornado of 100 mph. The tornado increased in size to about 200 yards hitting the Hub apartments and townhouses. There was extensive damage to windows, as well as roofing. The garage units had the most structural roofing and side wall damage. Winds increased to 110 mph.
The tornado became more elevated hitting several trees, power lines, and there was some apartment roofing damage near the Barren River. The tornado crossed interstate 65 near the 27 mile marker and was about 200 yards wide.
There was extensive tree damage and one barn was destroyed east of the interstate between Cumberland Trace Road and Porter Pike. Winds were between 90 and 100 mph, and then the tornado increased to EF2 120 mph striking the Corvette track and Motorsports Park. There was extensive damage to the main building and a series of garage and storage buildings had extensive structural damage to the individual roofs. Debris was thrown over half a mile to the east northeast. The tornado was 225 yards wide, and the survey team could see the main tornado damage about a half a mile away towards the Corvette plant on the other side of the interstate. NWS used drone technology to analyze the roofing structures for wind speed determinations.
The tornado weakened and paralleled Interstate 65 along McGinnis Road and Bristow Rd. Most of the damage was trees snapped, twisted, and uprooted facing from the northwest to the southeast direction. There was also some siding, gutter, and roofing damage. The tornado was between 100 and 150 yards wide and the wind speeds were around 90 to 95 mph before it lifted at the 29.2 mile marker.
The tornado began east of I-65 in Edmonson County where the Emergency Manager informed the National Weather Service of tree damage in this area. The tornado strengthened quickly and crossed into Barren County following along US 31W through Park City. In Park City the damage was rated EF1 with many barns encountering roof loss or complete failure, along with many trees found snapped or uprooted. The tornado continued along US 31W into Cave City where it strengthened to EF2 (130mph). The damage sustained here was major loss of roof structures to motels, hotels, and restaurants, highway signs destroyed, metal light poles collapsed, and major destruction to a trailer park. From here, the tornado continued along US 31W into Hart County through downtown Horse Cave. Here the damage was rated EF1 with small roof damage, large limbs being snapped, and walls blown out of some older tobacco warehouses. Once reaching Dawson Knob the tornado weakened and likely converged with the supercell moving into Hardyville. Due to the knob terrain in this area, there are spots of weaker damage found, however on the down-sloping side, the tornado strengthened rapidly. This pattern was found twice in this damage path.
The same supercell which came from Bowling Green extended another tornado to the ground on the down-sloping side of Fisher Ridge, just east of I-65 on Highway 335. Here, many barns collapsed on tobacco farms and hardwood trees were snapped. The tornado then continued through Rowletts where snapped/uprooted large trees and roof damage was found at the Caveland Country Club. The tornado then encountered terrain on Dawson Knob where little damage was found, however the tornado quickly intensified on the down-sloping side. The tornado continued down Shady Lane Church Rd. where it destroyed many homes, took roofs off structures and homes, collapsed well-built barns, destroyed an Amish schoolhouse, snapped/uprooted many trees, downed many powerlines, and took the lives of many farm animals. The tornado weakened to the northeast of Hardyville where damage was determined to be EF1 and EF0 through Summersville. The tornado lifted northeast of Summersville.
January 1, 2022 Tornadoes.
During New Year’s Eve into New Year’s Day, active weather was observed across Kentucky as several waves of low pressure moved along a frontal boundary that was stalled out across the region. This resulted in multiple rounds of widespread precipitation, and rainfall amounts of 2 to 4 inches with locally higher amounts were observed across the area. As the boundary lifted north as a warm front New Year’s Day, strong to severe storms were able to develop within the warm sector ahead of an approaching cold front, with multiple tornadoes and scattered straight-line wind damage being observed ( weather.gov).
On January 1, 2022 an EF-0 tornado hit the south side of Bowling Green.
NWS Storm Survey Teams found an area of straight line winds of 70 to 75 mph, beginning at the Hunting Creek subdivision off of Cave Mill Road. Along Cave Mill Road fences were blown down, minor shingle damage to homes occurred, and many pine and cedar trees were snapped and topped.
At the intersection of Curtis and Cave Mill Rd, there was a change in the damage pattern. The damage became more concentrated with gutters, shingles, roof, and soffit damage. Trees were snapped and uprooted facing to the north, northeast, and east southeasterly direction. Clear evidence was found of a weak tornado that formed with winds estimated between 80 and 85 mph. The tornado was slightly elevated off the ground and was very intermittent.
The tornado lifted just before the Marriott TownePlace Suites on Cave Mill Rd, and then there was sporadic straight-wind damage all the way to Ashton Parc Apartments off of Shive Lane. Thornton Furniture had the most damage from the straight-line winds with roofing and facade damage.
Read More at: https://www.wbko.com/2022/01/02/nws-confirms-tornado-hit-south-side-bowling-green-new-years-day/#:~:…,line%20winds%20to%2075%20mph
An EF-0 hit the Olmstead community in Logan County. This confirmed tornado was a continuation of a tornadic storm that crossed from Todd County Kentucky to Logan County Kentucky. The tornado first crossed the Todd/Logan county line about a mile south of Allensville around 12:17 PM EST. Small tree limbs were broken along Keysburg Road (KY Route 102). The tornado continued across mostly rural fields before striking a barn along Joe Riley road where major roof damage was observed as well as moderate tree damage. Near this location is where the max wind speeds were observed at 85 mph, or high end EF-0. This rating was changed from a previously reported EF-1 rating due to the nature of surrounding damage observed.
The tornado continued along rural open farm fields before damaging a mix of hard and softwood trees. Some trees had large limbs downed, while others had snapped trunks along Kenny Stratton Road west of Lickskillet. The tornado ended at around 12:21 PM EST along with no further damage observed past Olmstead Road.
An EF-1 tornado hit around the Omstead/Russellville area. This confirmed tornado was a continuation of the parent circulation that caused the tornado southwest of Olmstead KY that crossed the Todd/Logan county line. After a gap of more than 2 miles, the tornado redeveloped and caused damage along Watermelon Road. Minor roof damage occurred near this location. The tornado continued along JB Shackelford Road in mostly rural open farm fields before damage occurred along Johnson Young Road (Route 739). Several trees had large limbs down, and a hardwood tree was uprooted nearby. The strongest damage occurred as a nearby barn was completely demolished with estimated wind speeds at 110 mph for strong EF-1 winds.
The tornado then turned to the northeast causing minor damage to a porch covering at BL Shackelford Road. Damage continued toward Williams Store where significant tree damage occurred with several large trees either snapped or had large branches broken. The tornado then crossed rural areas west of Nashville Road (Highway 431).
At Nashville Road, a barn had roof damage observed with another outbuilding shifted off the foundation. At this point, the tornado appeared to strengthen with consistent damage just north of Ellis Road. A barn had a silo completely destroyed with major damage to 2 other silos, and drone footage confirmed several trees uprooted with branches snapped beyond this barn. The tornado then did some damage along Ellis road with roof damage observed at another barn.
An isolated tree snap occurred near the junction of Franklin Road (route 100) and Airport Road before the tornado crossed rural fields near the Russellville-Logan County Airport. The tornado continued to the northeast with damage observed to the west of Dennis Corinth Road to trees and barns.
NWS Storm Survey Teams found EF-0 tornado damage across northern Hart County. A barn along E Sullivan Rd was damaged where some of the roofing was found 400 yards away. The weak tornado was very elevated and next hit power lines on the east side of the road. The most significant damage was to a 100 x 50ft barn with damage thrown 200-250 yards back to the southwest. The barn foundation moved 18 inches to the east. A 2 x 4ft from the barn was thrown 60 yards to the north- northwest and was impaled into the 2nd story of an adjacent house. There was very minor tree damage as much of the tornado was highly elevated. The tornado lifted in a field just northeast of this residence.
NWS Storm Survey Teams found EF-1 tornado across northern Barren County. The damage began along the 2100 block of Carden Road which included a 80 x 100ft Amish built barn which was destroyed. Damage from the barn was thrown 400 yards to the northeast and east. Along Carden Road, trees were snapped, topped and twisted. There was sporadic roof damage to homes including gutters, siding, and shingle damage. Winds in this area were 90 to 95 mph with a width of 75 yards.
Along Highway 90, the tornado increased to a width of 125 yards with many barns incurring structural roof damage. At the Legacy Dairy Farms, an older 40 x 60ft barn was destroyed and there was sidewall damage to a large grain silo along Goodnight-Hiseville Road. Winds in this area were 85 mph.
Along Route 740, the tornado paralleled the road and the width increased to 150 yards. In Hiseville, there was barn damage with half a dozen barns sustaining significant structural damage. A 50ft diameter well-built grain silo was twisted and knocked over, and numerous trees were twisted, snapped, or uprooted. Most of the trees were facing north, northeast, east, and a few in the southeasterly direction. At the Hiseville Cemetery, modern and older gravestones were knocked over and cedar trees were knocked over and topped.
Probability
Between 2000 and 2021 (21 years), the BRADD Region experienced 68 tornadoes.
Wind Zone
The BRADD Region exists in the highest wind zone in the United States, zone IV, which translates to a threat of winds up to 250 miles per hour during a severe storm. This is the highest classification of wind zones and signifies the greatest tornado threat. The BRADD Region experiences the highest threat level for tornadoes during the spring months of April, May, and June; but as witnessed in December 2021, tornados can occur at any point in the year with the right conditions.
Draxl, C., B.M. Hodge, A. Clifton, and J. McCaa. 2015.
Overview and Meteorological Validation of the Wind Integration National Dataset Toolkit (Technical Report, NREL/TP-5000-61740). Golden, CO: National Renewable Energy Laboratory.
Draxl, C., B.M. Hodge, A. Clifton, and J. McCaa. 2015. “
The Wind Integration National Dataset (WIND) Toolkit.” Applied Energy 151: 355366.
Lieberman-Cribbin, W., C. Draxl, and A. Clifton. 2014.
Guide to Using the WIND Toolkit Validation Code (Technical Report, NREL/TP-5000-62595). Golden, CO: National Renewable Energy Laboratory.
King, J., A. Clifton, and B.M. Hodge. 2014.
Validation of Power Output for the WIND Toolkit (Technical Report, NREL/TP-5D00-61714). Golden, CO: National Renewable
Overall Probability
Overall, the BRADD Region experiences a high probability of a tornado event for the region as due to the frequency of past events, its wind zone classification, and as outlined using the classification definitions from FEMA.
Vulnerability
Tornadoes can be incredibly devastating to a community and can cause significant property damage and lead to injuries and loss of life.
Mobile Homes
Residents of mobile homes are particularly vulnerable to tornado events because mobile homes lack a foundation and use weak building materials. BRADD used 2019 ACS data to create a map that displays mobile home density by census tract. The percent of mobile homes by census tract ranges from 0% in Census Tract 105 in Warren County to 49.1% in Census Tract 9302 in Butler County.
To view specific data on the number and percent of housing units that are mobile homes, click on a census tract.
Impact
Tornadoes can produce rapid, high-consequence damage across the BRADD region, with impacts that cut across the built, natural, and social environments. Even brief EF-0/EF-1 events can tear roofs, shatter windows, topple trees and poles, and sever electric, communications, and water/wastewater lines; stronger EF-2+ tornadoes can destroy well-built structures, block major corridors with debris, and overwhelm emergency services. Natural systems experience tree loss, crop and livestock damage, and habitat disturbance, while downed timber can elevate fire risk if not cleared. Socially, tornadoes can cause injuries and fatalities, displace households, shutter schools and businesses, and trigger prolonged recovery—especially where vulnerable housing (e.g., mobile homes) and critical facilities lack hardened shelter options. Cascading effects—extended power outages, fuel and supply disruptions, and limited road access—can amplify community-wide consequences well beyond the narrow damage path.
Tornadoes have a significant impact on homes, utilities, buildings, and other structures. The BRADD region is vulnerable to tornadoes. The extent of damage depends not only on wind speed, but also on the mass and surface area of the object being struck. Secondary impacts of tornado damage result from damage to infrastructure. Downed power and communications transmission lines, coupled with disruptions to surface transportation, create difficulties in reporting and responding to emergencies.
Residential and commercial impact includes: damage to and destruction of buildings, loss of trees and landscaping, damage to and destruction of automobiles, trucks, and airplanes, disruptions to local utilities and services (power, communications, drinking water, and transportation).
The environmental impact of a tornado depends on the severity. Possible impacts include: damages to the plant species, loss of trees, and increased threat of fire where dead trees are not removed. There will also be a decrease in timber production due to loss of trees. The agriculture community could see a loss in crop yields, loss of livestock, and damage to farm machinery.
People
Tornadoes can cause death and injuries.
Economy
Social and economic disruption could be temporary. The community will experience revenue loss due to loss in production and industry.
The effect that climate change has on tornadoes is difficult to study because tornadoes occur on a small scale and the variability of frequency, which makes it difficult to tease out any significant trends. However, a 2015 empirical study published in Climate Dynamics founds changes in tornado climatology due to climate change. The researchers studied the annual number of days with multiple tornadoes against the ratio of days with only one tornado. This data showed that there has been a decrease in the number of days with at least one tornado and an increase in days with multiple tornadoes, or an increase in tornado clusters. The explanation given to this change was that climate change has increased the number of days conducive to severe storms and tornadoes through increases in convective available potential energy (CAPE). Essentially, global warming has increased the overall temperature of the atmosphere and has affected local-scale thermodynamics. As air warms and rises, it carries moisture to higher altitudes. Vertical wind shear comingles with The research conducted by Stanford indicated that global warming has increased the number of days that produce CAPE (CAPE) with sufficient vertical wind shear to form severe storms. In essence, climate change increases the likelihood that severe storms will occur by creating the conditions for a storm more often.
Working with
AT&T’s Climate Resilient Communities Program and the
Climate Risk and Resilience (ClimRR) Portal, BRADD identified additional opportunities for hazard mitigation action items associated with climate impacts for Severe Weather in the Barren River Region. To view an interactive report of these findings,
click here.
Hazard Vulnerability Summary Analysis
Click the county names below to review vulnerability analysis by county. Overall vulnerability is defined using the classification definitions from FEMA.
Between 2000 and 2021, Allen County has experienced 7 tornadoes/21years =33% chance of a tornado happening in a given year.
Since 1950, tornadoes that touched down in Allen County have caused 11 injuries and 4 deaths.
Allen County contains two census tracts wherein at least 25% of all housing units are mobile homes.
Because of these factors, Allen County experiences moderate vulnerability to tornadoes. Scottsville reflects Allen County’s overall history of severe storms, and therefore experiences moderate vulnerability as well.
Between 2000 and 2021, Barren County has experienced 7 tornadoes/21years =33% chance of a tornado happening in a given year.
Since 1950, tornadoes that touched down in Barren County have caused 51 injuries and 3 deaths.
Barren County contains two census tracts wherein at least 25% of all housing units are mobile homes.
Because of these factors, Barren County experiences moderate vulnerability to tornadoes. Cave City, Glasgow, and Park City reflect Barren County’s overall history of tornado events, and therefore experience moderate vulnerability as well.
Between 2000 and 2021, Butler County has experienced 4 tornadoes/21years =19% chance of a tornado happening in a given year.
Since 1950, tornadoes that touched down in Butler County have caused 1 injury and 1 death.
Butler County contains one census tract wherein at least 25% of all housing units are mobile homes.
Because of these factors, Butler County experiences moderate vulnerability to tornadoes. Morgantown, Rochester, and Woodbury reflect Butler County’s overall history of tornado events, and therefore experiences moderate vulnerability as well.
Between 2000 and 2021, Edmonson County has experienced 6 tornadoes/21years =29% chance of a tornado happening in a given year.
Since 1950, tornadoes that touched down in Edmonson County have caused 2 injuries and 0 deaths.
Edmonson County contains four census tracts wherein at least 25% of all housing units are mobile homes.
Because of these factors, Edmonson County experiences moderate vulnerability to tornadoes. Brownsville reflects Edmonson County’s overall history of tornado events, and therefore experiences moderate vulnerability as well.
Between 2000 and 2021, Hart County has experienced 7 tornadoes/21years =33% chance of a tornado happening in a given year.
Since 1950, tornadoes that touched down in Hart County have caused 22 injuries and 1 death.
Hart County contains two census tracts wherein at least 25% of all housing units are mobile homes.
Because of these factors, Hart County experiences moderate vulnerability to tornadoes. Bonnieville, Horse Cave, and Munfordville reflect Hart County’s overall history of tornado events, and therefore experience moderate vulnerability as well.
Between 2000 and 2021, Logan County has experienced 7 tornadoes/21years =33% chance of a tornado happening in a given year.
Since 1950, tornadoes that touched down in Logan County have caused 23 injuries and 2 deaths.
Logan County does not contain any census tracts wherein at least 25% of all housing units are mobile homes.
Because of these factors, Logan County experiences moderate vulnerability to tornadoes. Adairville, Auburn, Lewisburg, and Russellville all reflect Logan County’s overall history of tornado events, and therefore experience moderate vulnerability as well.
Between 2000 and 2021, Metcalfe County has experienced 8 tornadoes/21years =33% chance of a tornado happening in a given year.
Since 1950, tornadoes that touched down in Metcalfe County have caused 7 injuries and 3 deaths.
Metcalfe County does not contain any census tracts wherein at least 25% of all housing units are mobile homes.
Because of these factors, Metcalfe County experiences high vulnerability to tornadoes. Edmonton reflects Metcalfe County’s overall history of tornado events, and therefore experiences high vulnerability as well.
Between 2000 and 2021, Monroe County has experienced 8 tornadoes/21 years = 33% chance of a tornado happening in a given year.
Since 1950, tornadoes that touched down in Monroe County have not caused injury or death.
Monroe County contains one census tract wherein at least 25% of all housing units are mobile homes.
Because of these factors, Monroe County experiences high vulnerability to tornadoes. Fountain Run, Gamaliel, and Tompkinsville all reflect Monroe County’s overall history of tornado events, and therefore experience high vulnerability as well.
Between 2000 and 2021, Simpson County has experienced 6 tornadoes/21years =28.5% chance of a tornado happening in a given year.
Since 1950, tornadoes that touched down in Simpson County have caused 13 injuries and 1 death.
Simpson County does not contain any census tracts wherein at least 25% of all housing units are mobile homes.
Because of these factors, Simpson County experiences moderate vulnerability to tornadoes. Franklin reflects Simpson County’s overall history of tornado events, and therefore experiences moderate vulnerability as well.
Between 2000 and 2021, Warren County has experienced 9 tornadoes/21years =43% chance of a tornado happening in a given year.
Since 1950, tornadoes that touched down in Warren County have caused 51 injuries and 2 deaths.
Warren County contains one census tract wherein at least 25% of all housing units are mobile homes.
Because of these factors, Warren County experiences high vulnerability to tornadoes. Bowling Green, Plum Springs, Oakland, Smiths Grove, and Woodburn all reflect Warren County’s overall history of tornado events, and therefore experience high vulnerability as well.