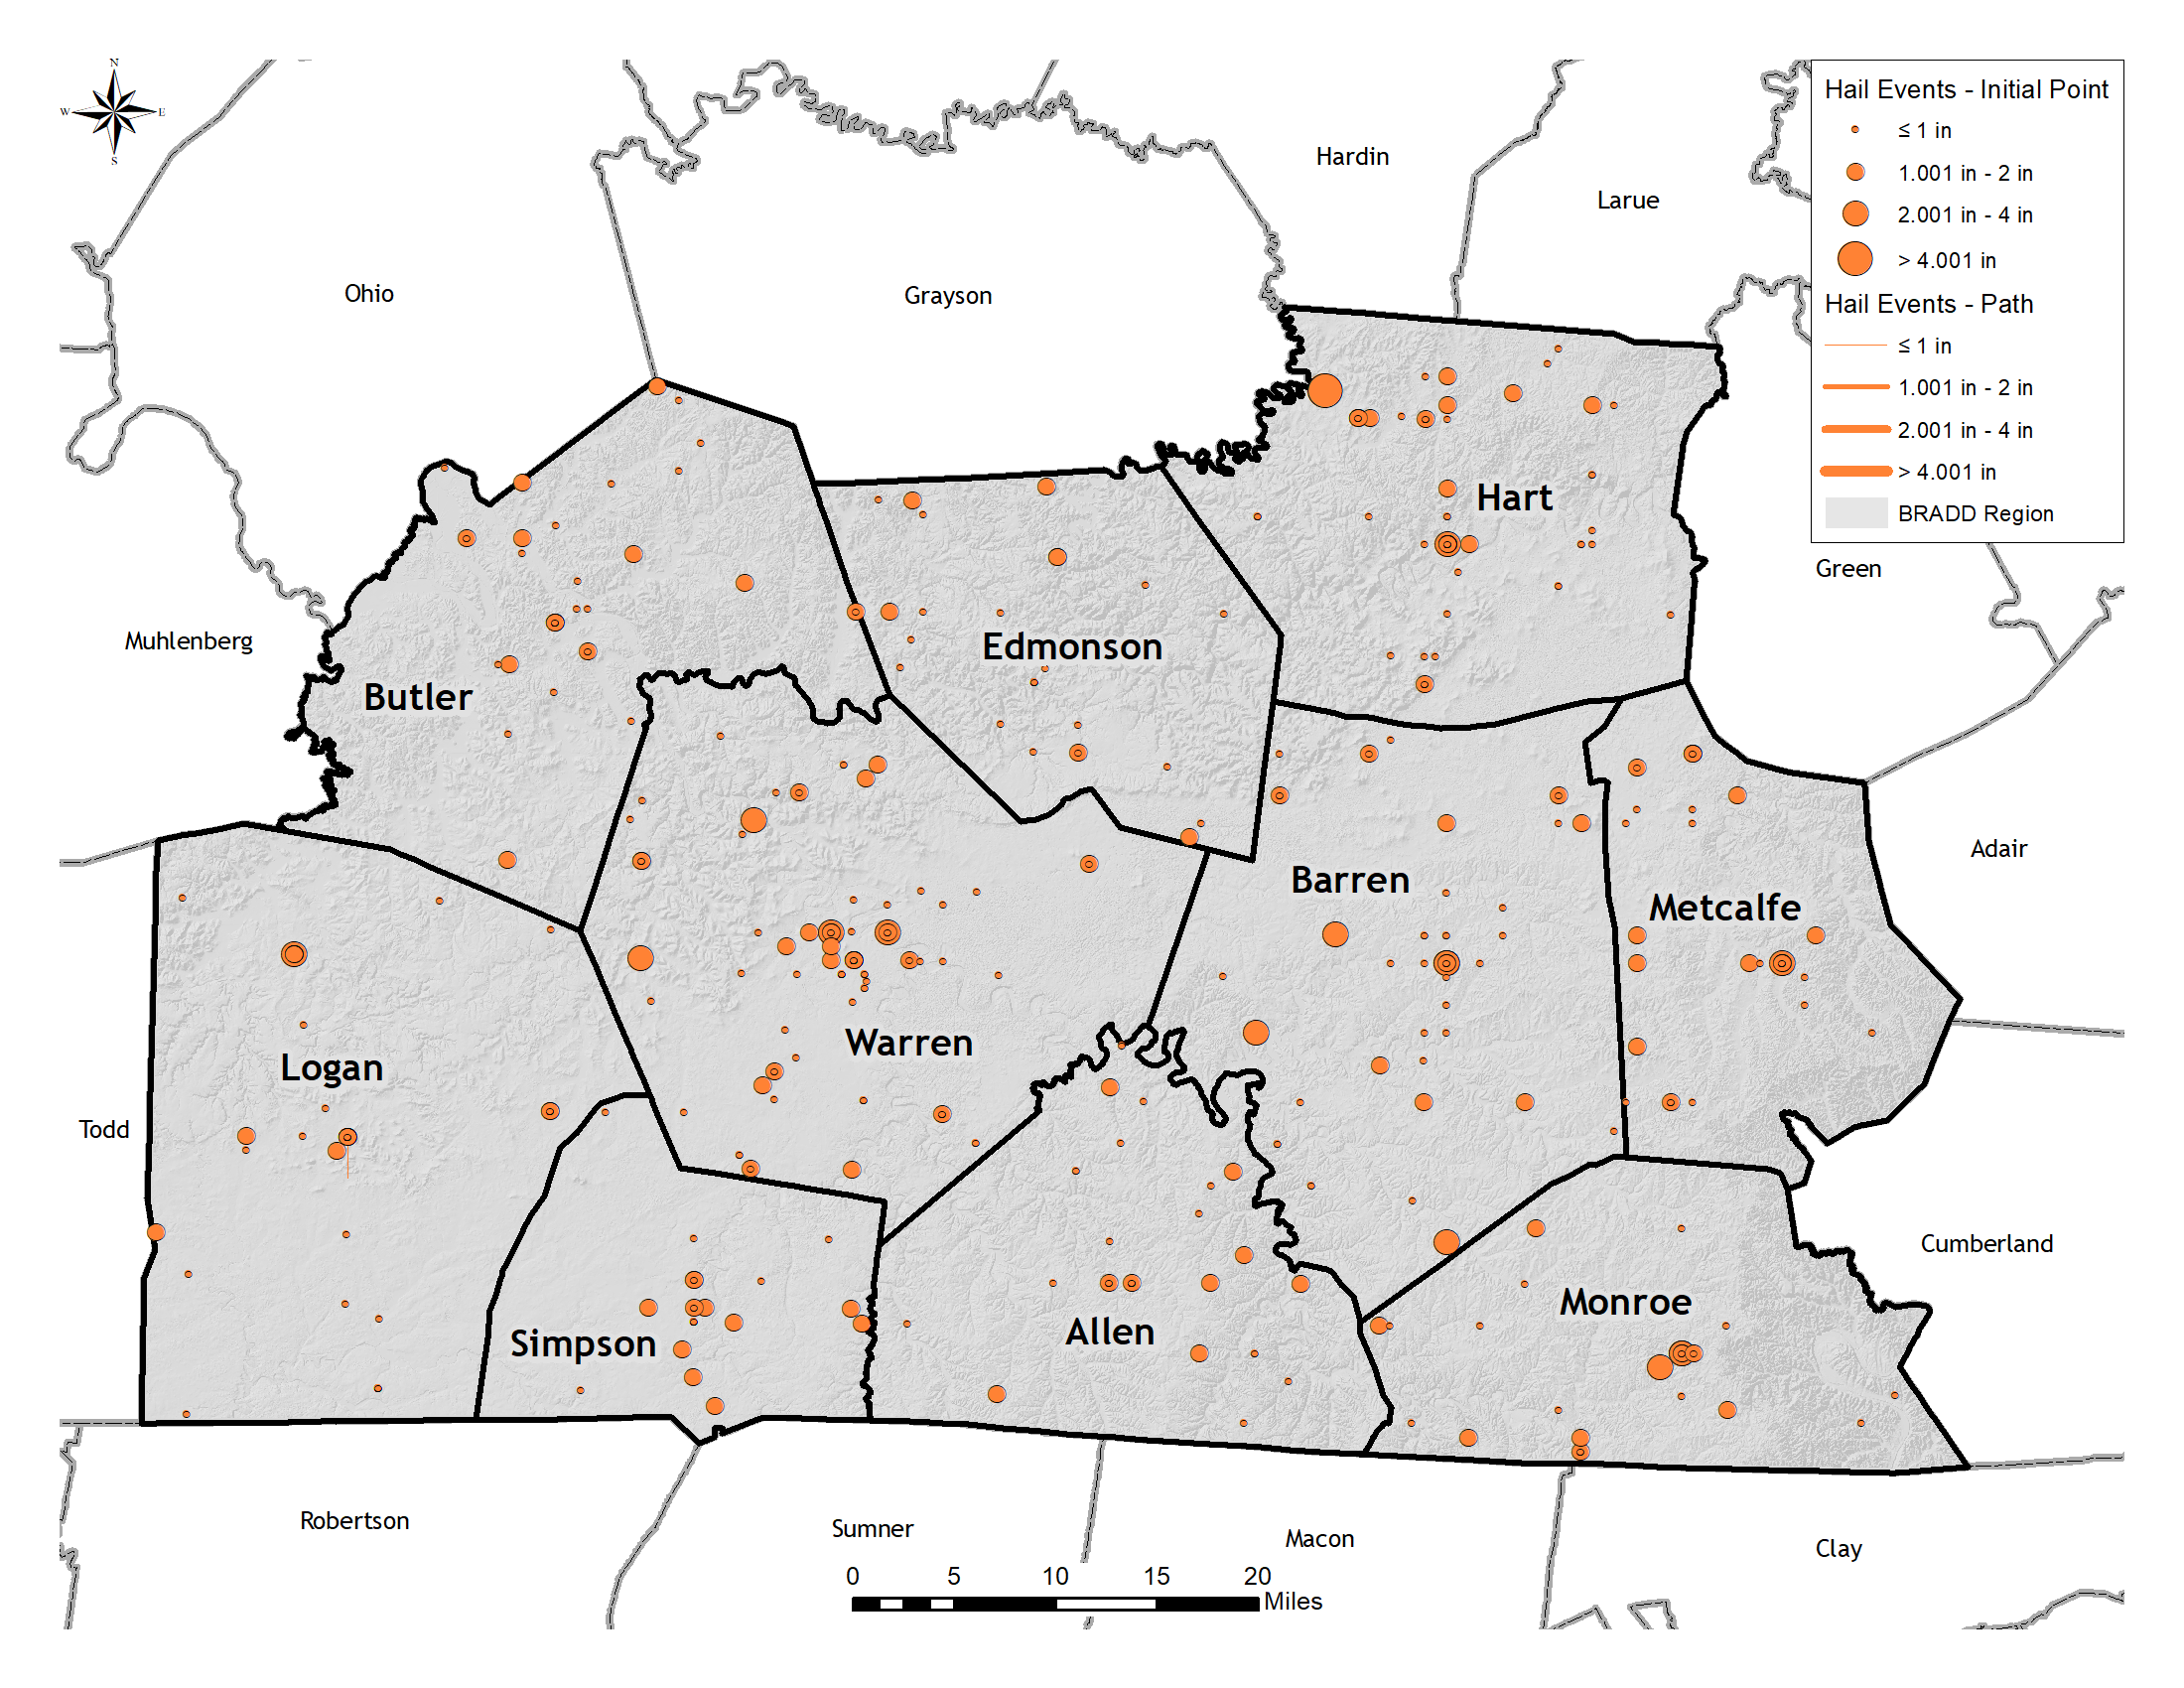
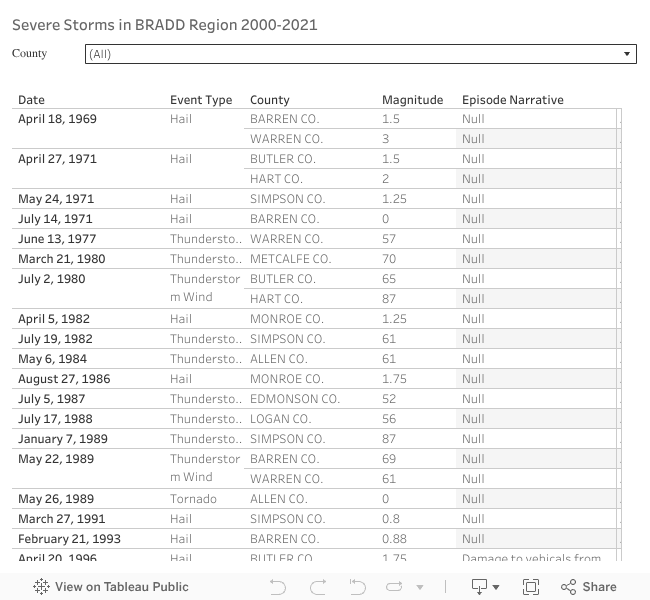
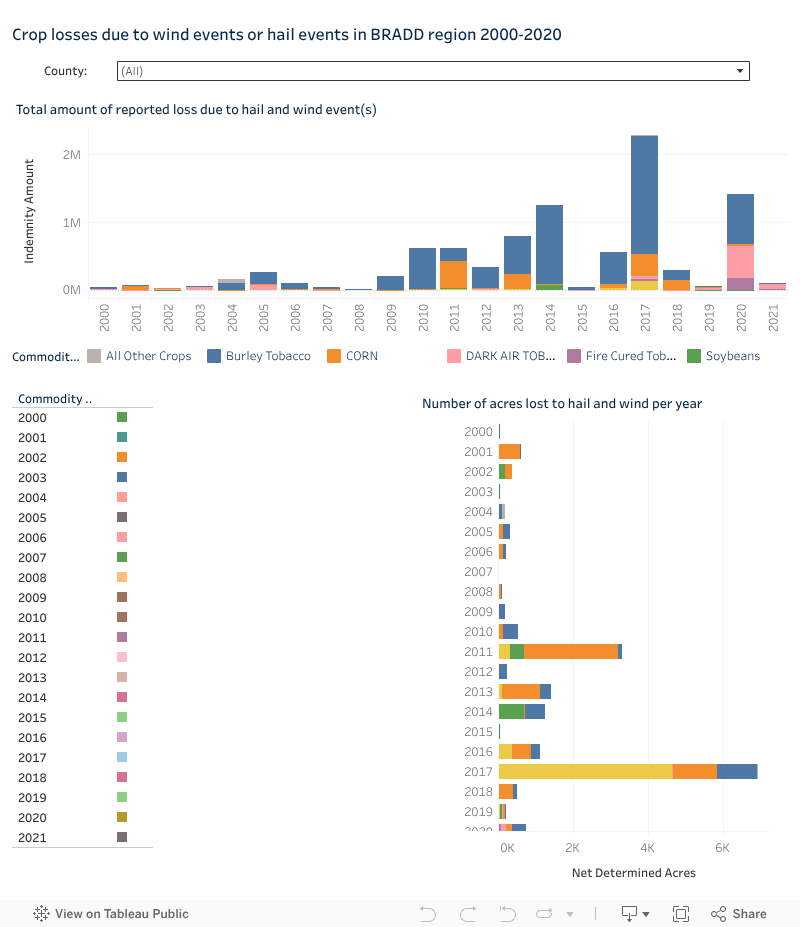
Severe Storms

A severe storm is an atmospheric disturbance that results in one or more of the following phenomena: strong winds and large hail, lightning, thunderstorms, tornadoes, rain, snow, or other mixed precipitation. The following severe storm elements are considered for this profile (using National Weather Service definitions):

Severe Thunderstorm is a rain shower during which you hear thunder. Since thunder comes from lightning, all thunderstorms have lightning. A thunderstorm is classified as “severe” when it contains on or more of the following: hail three-quarter inch or greater, wind gusts in excess of 50 knots (57.5 mph), and tornado. The hazard profile for severe storm will evaluate hail, wind, and lightning strikes in the BRADD region. Tornadoes have a separate hazard profile.

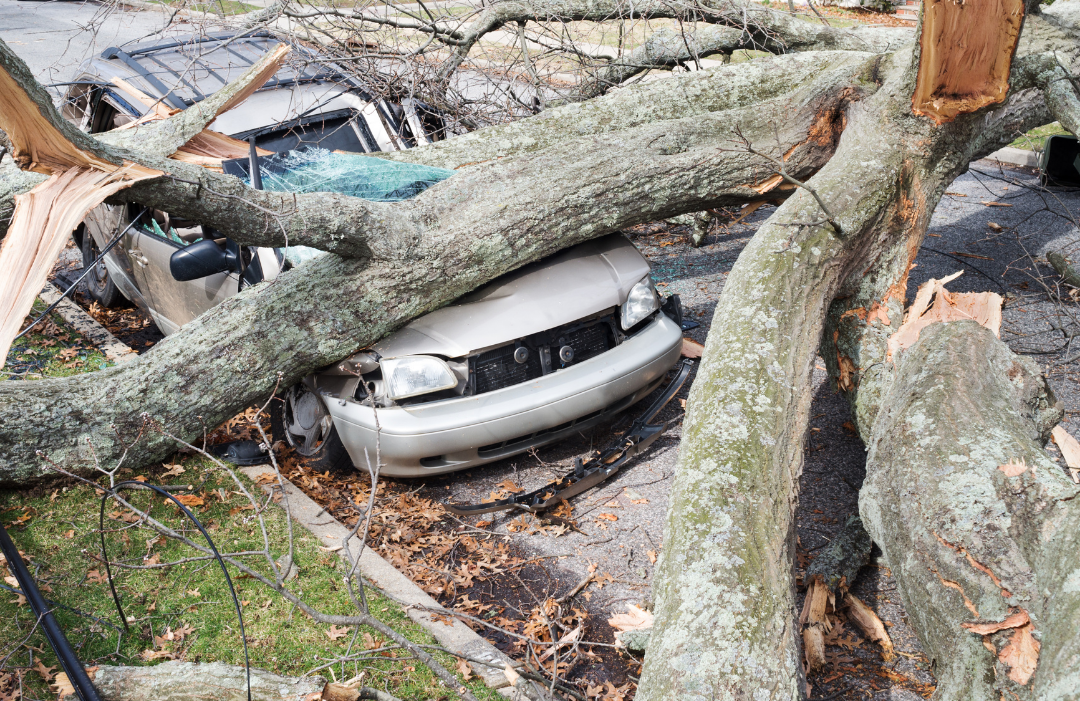
Straight-line wind occurs when a current of air in which the ground-relative motion does not have any significant curvature and, in extreme cases, have the potential to exceed 100 miles per hour. The severity and damages occurring during straight-line wind events directly correlate to estimated wind speed.

Thunderstorms are typically caused by convection that occurs when the sun has heated a large body of moist air near the ground. This air rises and is cooled by expansion. The cooling condenses the water vapor present in the air, forming a cumulus cloud aggregation of minute particles of water or ice suspended in the air. If this process continues, the summit of the cloud often attains a height of 4 miles above the base, and the top spreads out in the shape of an anvil.

The turbulent air currents within the cloud cause a continual breaking up and reuniting of the raindrops, which may form hail, and builds up strong electrical charges that result in lightning. As the storm approaches an area, the gentle flow of warm air feeding the cloud gives way to a strong, chilly gust of wind from the opposite direction, blowing from the base of the cloud. Intense rain begins and then gradually diminishes as the storm passes.

  • Ordinary cell: As the name implies, there is usually only one cell with this type of thunderstorm. Also called a “pulse” thunderstorm, the ordinary cell consists of a onetime updraft and one time downdraft.
  • Multi-cluster cell: While each individual thunderstorms cell, in a multi-cell cluster, behaves as a single cell, the prevailing atmospheric conditions are such that as the first cell matures, it is carried downstream by the upper level winds and new cell forms upwind of the previous cell to take its place.
  • Multi-cell line: Sometimes thunderstorms will form in a line which can extend laterally for hundreds of miles. These “squall lines” can persist for many hours and produce damaging winds and hail.
  • Supercell thunderstorms are a special kind of single cell thunderstorm that can persist for many hours. They are responsible for nearly all of the significant tornadoes produced in the U.S. and for most of the hailstones larger than golf ball size. Supercells are also known to produce extreme winds and flash flooding.
  • Straight line winds are winds that come out of a thunderstorm. To be classified as severe, they must exceed 58 miles per hour.
  • Lightning
  • Flash Floods
  • Hail
  • Outflow
  • Tornadoes
  • Winds

Location, Extent, & Past Events

Lightening Density in the BRADD Region – Original Map Credit: Chris Vagasky, Vaisala

In the past 21 years, the BRADD Region has experienced 1120 severe storm events according to the NCEI database. 

Please note that thunderstorm or high wind events that happened on the same date are classified as the same event. 

  • Allen County: 105 severe storm events/21 years = 5 wind events annually
  • Barren County: 152 severe storm events/21 years = 7.23 wind events annually
  • Butler County: 81 severe storm events/21 years = 3.85 wind events annually
  • Edmonson: 84 severe storm events/21 years = 4 wind events annually
  • Hart: 97 severe storm events/21 years = 4.61 wind events annually
  • Logan: 138 severe storm events/21 years = 6.57 wind events annually
  • Metcalfe: 80 severe storm events/21 years = 3.8 wind events annually
  • Monroe: 78 severe storm events/21 years = 3.74 wind events annually
  • Simpson: 92 severe storm events/21 years = 4.38 wind events annually
  • Warren: 198 severe storm events/21 years = 9.42 wind events annually

Research conducted by Stanford University using physics-based climate models has confirmed that climate change has had an impact on the prevalence and severity of severe storms. The study concluded that climate change variables have caused an increase in severe storm environments. They studied the effect of greenhouse forcing on generic severe storm conditions, which they define to include hail, damaging straight-line winds, and/or tornadoes. The term forcing refers to any influence that may shift or change the climate. Therefore, the study if greenhouse gases increased the environmental conditions in which severe storms develop using computer modelling.

There are two main conditions that must be present for a severe storm to occur: CAPE and Vertical Shear Wind. Cape, or convective available potential energy, is created when the air in a low atmosphere warms. At the air warms and rise, it carries moisture to higher altitudes. Vertical wind shear is a moving wind that, when intermingled with CAP, can sustain a storm. The research conducted by Stanford indicated that global warming has increased the number of days that produce CAPE with sufficient vertical wind shear to form severe storms. In essence, climate change increases the likelihood that severe storms will occur by creating the conditions for a storm more often.

Overall, the BRADD Region’s probability of a severe storm event for the region ranks as high because of its annual frequency and as outlined using the classification definitions from FEMA

Impact & Vulnerability

Impact on Agriculture

This dashboard displays the indemnity amount, which represents the dollar amount of yield loss due to wind. The dashboard also shows the number of acres that were impacted by wind. BRADD staff included hot wind and wind/excess wind to filter for wind events.

Source: USDA Risk Management Agency

Vehicles, roofs of buildings and homes, and landscaping are most commonly damaged during severe storms, especially hail. Hail up to the size of softballs damages cars and windows, and kills wildlife caught out in the open.

Water supply and sewer facilities may be vulnerable to severe storms with massive rainwater that quickly accumulates. Storm water drains and culverts may overflow during a heavy rain event and cause flooding, leaving many roads impassable.

The region could also experience a disruption to local utilities and services. Strong straight-line winds associated with thunderstorms knock down trees and power lines leaving communities without power or communications for hours or weeks.

Severe storms impact the natural environment by increasing storm water runoff, as well as increasing flooding and tree displacement. Such alteration of the natural environment will impact fish and wildlife habitat. However, these are natural processes; absent prolong climate changes, animals and their ecosystems are resilient to temporary changes in weather. Much of the damage inflicted by these storms is to crops and livestock.
People
Severe storms do not affect specific targets differently. Although, people outside may not have access to warning information, so boaters, campers, construction workers, and farmers are very susceptible.

Economy
Economic costs associated with severe storms are due to replacement costs for any property damaged. If transportation and telecommunication networks are damaged or destroyed, it may lead to business closures for a brief time.

Hazard Vulnerability Summary Analysis

Severe storms are non-spatial hazards, and no jurisdiction is more likely to experience a severe storm than another. However, areas that are more densely populated such as Bowling Green, Glasgow, and Russellville are more vulnerable to property damage because these jurisdictions contain a significant built environment.  To explore vulnerability by county, click the links below. Overall vulnerability is defined using the classification definitions from FEMA.

Allen County has experienced 105 severe storm events/21 years = 5 wind events annually.

Because of these factors, Allen County experiences high vulnerability to severe storms. Scottsville reflects Allen County’s overall history of severe storms, and therefore experiences high vulnerability as well.
Barren County has experienced 152 severe storm events/21 years = 7.23 wind events annually.

Because of these factors, Barren County experiences high vulnerability to severe storms. Cave City, Glasgow, and Park City reflect Barren County’s overall history of severe storms, and therefore experience high vulnerability as well.
Butler County has experienced 81 severe storm events/21 years = 3.85 wind events annually.

Because of these factors, Butler County experiences high vulnerability to severe storms. Morgantown, Rochester, and Woodbury reflect Butler County’s overall history of severe storms, and therefore experience high vulnerability as well.
Edmonson County has experienced 84 severe storm events/21 years = 4 wind events annually.

Because of these factors, Edmonson County experiences high vulnerability to severe storms. Brownsville reflects Edmonson County’s overall history of winter storms, and therefore experiences high vulnerability as well.
Hart County has experienced 97 severe storm events/21 years = 4.61 wind events annually.

Because of these factors, Hart County experiences high vulnerability to severe storms. Bonnieville, Horse Cave, and Munfordville reflect Hart County’s overall history of severe storms, and therefore experience high vulnerability as well.
Logan County has experienced 138 severe storm events/21 years = 6.57 wind events annually.

Because of these factors, Logan County experiences high vulnerability to severe storms. Adairville, Auburn, Lewisburg, and Russellville reflect Logan County’s overall history of severe storms, and therefore experience high vulnerability as well.
Metcalfe County has experienced 80 severe storm events/21 years = 3.8 wind events annually.

Because of these factors, Metcalfe County experiences high vulnerability to severe storms. Edmonton reflects Metcalfe County’s overall history of winter storms, and therefore experiences high vulnerability as well.
Monroe County has experienced 78 severe storm events/21 years = 3.74 wind events annually.

Because of these factors, Monroe County experiences high vulnerability to severe storms. Fountain Run, Gamaliel, and Tompkinsville reflect Monroe County’s overall history of winter storms, and therefore experience high vulnerability as well.
Simpson County has experienced 92 severe storm events/21 years = 4.38 wind events annually.

Because of these factors, Simpson County experiences high vulnerability to severe storms. Franklin reflects Simpson County’s overall history of winter storms, and therefore experiences high vulnerability as well.
Warren County has experienced 198 severe storm events/21 years = 9.42 wind events annually.

Because of these factors, Warren County experiences high vulnerability to severe storms. Bowling Green, Plum Springs, Oakland, Smiths Grove, and Woodburn all reflect Warren County’s overall history of severe storms, and therefore experience high vulnerability as well.