Extreme Temperature

BRADD’s Hazard Mitigation Plan focuses on both Extreme Cold and Extreme Heat as hazard events. Information on both aspects of extreme temperature can be found below.

Extreme Cold/Cold waves occur in the winter months, particularly during December and January. Typically, there a 24+ hour warning time before a cold wave moves into an area.

Extreme Heat/Heat waves occur in the summer months and can typically be predicted a few days in advance through weather monitoring.

Extreme Cold

The wind chill index is frequently used to alert the general public to the dangers of exposure to the cold. This index was originally developed by American explorers and geographers Paul Siple and Charles Passel when they were exploring the Antarctic in the 1940s. The researchers hung bottles of water outside of their camp to determine how long it took the water inside to freeze under certain wind conditions. Their observations were translated into the wind chill index used by the National Weather Service and meteorologists to convey in a way that is understandable to the public how the temperature feels. The index combines wind speed and temperature to measure their combined effect on the human body.

Wind Chill Chart from National Weather Service

A wind chill warning will be issued when wind chill temperatures are expected to reach -10°F or colder with a minimum wind speed of about 10 mph.

In cold winter months, National Weather Service weather forecast offices routinely issue two types of alerts to warn people about dangerously low wind chill temperatures.

  • Wind chill watch: issued when wind chill temperatures are potentially hazardous.
  • Wind chill warning: issued when wind chill temperatures are life threatening.

However, temperature criteria for an advisory or warning can vary from state to state to reflect regional climate differences. Because of the relative nature of what constitutes extreme cold, BRADD has decided to use wind chill watches and wind chill warnings as a measure of extent in the region. 

Between 2010 and 2021, each county in the BRADD Region experienced 1 wind chill watch in 2014 and 1 wind chill warning in 2015. Neither event resulted in an extreme cold event nor did either event produce any damages. Therefore, each county in the BRADD Region has a 0.9% chance of receiving a wind chill watch and wind chill warning annually. Wind chill watches and warnings occur at the county and not city level.

Though the cold waves and low temperatures is often cited by skeptics as a counter-argument, an up-tick in the severity and frequency of cold weather is a result of the changing climate. The relevant phenomenon is known as Arctic Amplification. As the Arctic region warms and snow and ice disappear, the remaining open water is less reflective to sunlight than ice, resulting in increased warming. The jet stream winds have slowed down as a result of the gap has lessened between temperatures in the Arctic and the mid-latitudes. Slower wind streams have caused more extreme weather. When a wavy jet stream occurs during the winter, cold air is pulled south and regions that are warmer experience unprecedented cold waves.

It is unclear if climate change will impact the number of extreme cold events in the BRADD Region. As shown in the graphic below, the mean temperature during winter months is increasing. Therefore, the BRADD Region can expect fewer days below freezing, but this does not necessarily translate to fewer extreme cold events. Climate change increases the frequency of unexpected, extreme events like an extreme cold event.  

This graphic was generated from University of California Irvine’s Climate Toolbox site. BRADD Staff selected a general location in the BRADD Region (between Plum Springs and Brownsville) and selected a higher emissions scenario (RCP 8.5) to develop the projection. The 1990s figure is based off of historical records for the area, while the the other temperatures are projections from University of Idaho’s gridMET dataset

Climate Change Projections on Winter Temperatures from Climate Tool Box

Overall, the probability of an extreme cold event occurring in the BRADD Region is occasional due to past events and the impacts of climate change and as outlined using the classification definitions from FEMA.

Since 2010, the BRADD region has experienced one wind chill watch (2014) and one wind chill warning (2015). The one watch and one warning were issued for each county in the region. The dates of the wind chill warnings and watch were obtained from the Iowa Environmental Mesonet. The Iowa Environmental Mesonet is a product of Iowa State University, and it collects national environmental data from cooperating members within observing networks. BRADD employed data on wind chill watch and warnings from the Iowa Environmental Mesonet because the NOAA’s National Center for Environmental Information (NCEI) did not have any records for wind chill and warning events within the BRADD region in the past 20+ years.

Built Environment
There are a variety of transportation impacts due to cold weather. Diesel engines are stressed and, often fuel gels in extreme cold weather impacting trucking and rail traffic. Rivers and lakes freeze, stopping barge and ship traffic. Subsequent ice jams threaten bridges and can close major highways. Shear cold temperatures stress metal bridge structures. Extreme cold temperatures can cause significant ground freezing problems, especially if there is little snow cover. Buried water pipes can burst causing massive ice problems and loss of water pressure. This poses a variety of public health and public safety problems.

Natural Environment
Cold temperatures can put the lives of humans, animals, and plant species in danger. The impact of a cold wave on agriculture is frequently discussed in terms of frost and freeze impacts early or late in the growing seasons. Prolonged cold snaps can impact livestock not protected from the frigid temperatures. Frozen ponds, streams, and rivers will disturb the ecosystem.

People
Vulnerable populations who do not have access to shelter or a reliable heating source may experience dangerous impacts to their physical health and well-being due to exposure to the cold; Some homes can be at a higher risk of fire from overburdened chimneys and carbon monoxide poisoning from exhaust produced by heaters and generators.

Economy
Cost of replacing utility infrastructure that is damaged during the cold wave; lost revenue from agriculture; lost wages if cold wave forces business and school closure

Climate change models predict and increase in overall temperature globally for the coming decades, including the BRADD region. With a potential rise of several degrees Fahrenheit, multiple services, systems, and activities face disruption and impact. Temperature increases this small may not seem threatening, but the cumulative impacts will affect weather events, human health, and ecosystem functions, along with economic and social issues related to energy use and cost of living.

Extreme cold is a non-spatial hazard, and the entire planning area is equally vulnerable. It should be noted that several emergency managers in the region listed extreme cold coupled with ice events as particularly concerning. This is because ice events can easily take out power sources, and leave residents in homes without power during very cold temperatures. To view vulnerability by county, click on the links below. Overall vulnerability is defined using the classification definitions from FEMA.

Since 2010, Allen County experienced one wind chill watch (2014) and one wind chill warning (2015).

Because of these factors, Allen County experiences moderate vulnerability to extreme cold events. Scottsville reflects Allen County’s overall history of extreme cold, and therefore experiences high vulnerability as well.
Since 2010, Barren County has experienced one wind chill watch (2014) and one wind chill warning (2015).

Because of these factors, Barren County experiences moderate vulnerability to extreme cold events. Cave City, Glasgow, and Park City reflect Barren County’s overall history of extreme cold, and therefore experiences high vulnerability as well.
Since 2010, Butler County experienced one wind chill watch (2014) and one wind chill warning (2015).

Because of these factors, Butler County experiences moderate vulnerability to extreme cold events. Morgantown, Rochester, and Woodbury reflect Butler County’s overall history of extreme cold, and therefore experience high vulnerability as well.
Since 2010, Edmonson County experienced one wind chill watch (2014) and one wind chill warning (2015).

Because of these factors, Edmonson County experiences moderate vulnerability to extreme cold events. Brownsville reflects Edmonson County’s overall history of extreme cold, and therefore experiences high vulnerability as well.
Since 2010, Hart County experienced one wind chill watch (2014) and one wind chill warning (2015).

Because of these factors, Hart County experiences moderate vulnerability to extreme cold events. Bonnieville, Horse Cave, and Munfordville reflect Hart County’s overall history of extreme cold, and therefore experience high vulnerability as well.
Since 2010, Logan County experienced one wind chill watch (2014) and one wind chill warning (2015).

Because of these factors, Logan County experiences moderate vulnerability to extreme cold events. Adairville, Auburn, Lewisburg, and Russellville reflect Logan County’s overall history of extreme cold, and therefore experience high vulnerability as well.
Since 2010, Metcalfe County experienced one wind chill watch (2014) and one wind chill warning (2015).

Because of these factors, Metcalfe County experiences moderate vulnerability to extreme cold events. Edmonton reflects Metcalfe County’s overall history of extreme cold, and therefore experiences high vulnerability as well.
Since 2010, Monroe County experienced one wind chill watch (2014) and one wind chill warning (2015).

Because of these factors, Monroe County experiences moderate vulnerability to extreme cold events. Fountain Run, Gamaliel, and Tomkinsville reflect Monroe County’s overall history of extreme cold, and therefore experience high vulnerability as well.
Since 2010, Simpson County experienced one wind chill watch (2014) and one wind chill warning (2015).

Because of these factors, Simpson County experiences moderate vulnerability to extreme cold events. Franklin reflects Simpson County’s overall history of extreme cold, and therefore experiences high vulnerability as well.
Since 2010, Warren County has experienced one wind chill watch (2014) and one wind chill warning (2015).

Because of these factors, Warren County experiences moderate vulnerability to extreme cold events. Bowling Green, Oakland, Plum Springs, Smiths Grove, and Woodburn reflect Warren County’s overall history of extreme cold, and therefore experience high vulnerability as well.

Extreme Heat

Extreme Temperature/Heat waves occur in the summer months and can typically be predicted a few days in advance through weather monitoring.

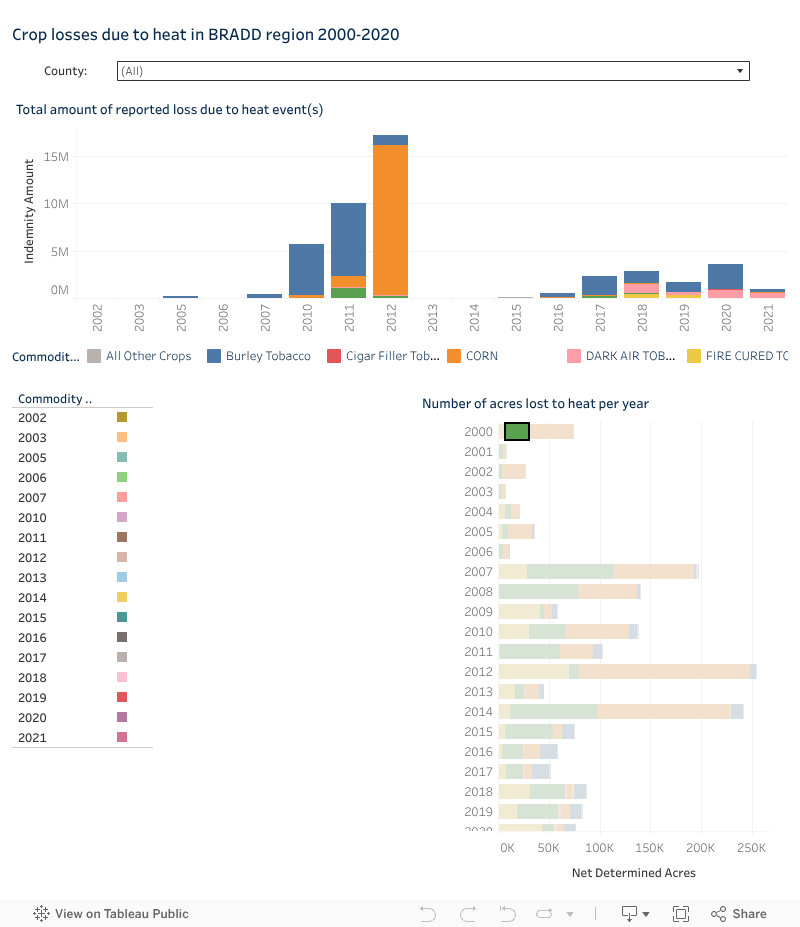
A heat wave is a space of unusually hot temperatures for a given amount of time for an area. For the BRADD region, any streak of temperatures above 90 degrees gives way to a potential heat wave. Usually accompanying a heat wave is drought, an extensive span of time with little to no rainfall that totals far below the norm.

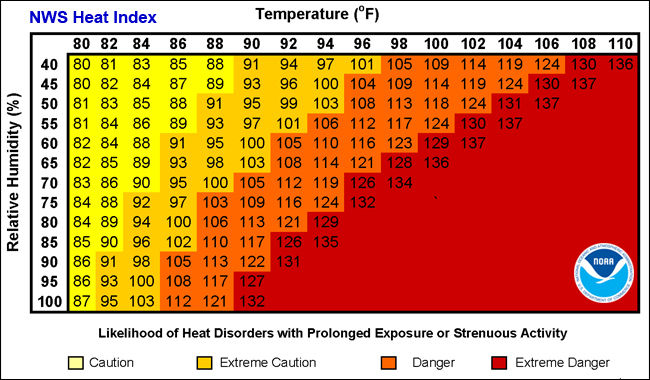
The NWS’s heat alert procedures are based mainly on Heat Index Values. The Heat Index is a measure of how hot it feels when relative humidity is factored in with the actual air temperature.

Heat Index Chart from National Weather Service

The National Weather Service offers the following alerts for heat safety:

  • Excessive Heat Warning: the maximum heat index temperature is expected to be 105° or higher for at least 2 days and night time air temperatures will not drop below 75°.
  • Excessive Heat Watches:  Heat watches are issued when conditions are favorable for an excessive heat event in the next 24 to 72 hours. A Watch is used when the risk of a heat wave has increased but its occurrence and timing is still uncertain.
  • Heat Advisory:  The maximum heat index temperature is expected to be 100° or higher for at least 2 days, and night time air temperatures will not drop below 75°.
  • Excessive Heat Outlooks: The outlooks are issued when the potential exists for an excessive heat event in the next 3-7 days. 

Between 2010 and 2021, each county in the BRADD Region experienced 18 excessive heat watch events and 71 excessive heat warning events. Heat warnings occur at the county and not city level. A breakdown of past excessive heat warning and watch events by county is listed below.

  • Allen County:
    • 6 excessive heat warning events/11 years = .54 heat warning events annually;
    • 1 excessive heat watch event/11 years = .09 heat watch events annually
  • Barren County:
    • 6 excessive heat warning events/11 years = .54 heat warning events annually;
    • 3 excessive heat watch event/11 years = .09 heat watch events annually
  • Butler County:
    • 9 excessive heat warning events/11 years = .81 heat warning events annually;
    • 3 excessive heat watch event/11 years = .27 heat watch events annually
  • Edmonson:
    • 9 excessive heat warning events/11 years = .81 heat warning events annually;
    • 3 excessive heat watch event/11 years = .27 heat watch events annually
  • Hart:
    • 6 excessive heat warning events/11 years = .54 heat warning events annually;
    • 1 excessive heat watch event/11 years = .09 heat watch events annually
  • Logan:
    • 9 excessive heat warning events/11 years = .81 heat warning events annually;
    • 2 excessive heat watch event/11 years = .18 heat watch events annually
  • Metcalfe:
    • 4 excessive heat warning events/11 years = .36 heat warning events annually;
    • 1 excessive heat watch event/11 years = .09 heat watch events annually
  • Monroe:
    • 4 excessive heat warning events/11 years = .36 heat warning events annually;
    • 1 excessive heat watch event/11 years = .09 heat watch events annually
  • Simpson:
    • 9 excessive heat warning events/11 years = .81 heat warning events annually;
    • 2 excessive heat watch event/11 years = .18 heat watch events annually
  • Warren:
    • 9 excessive heat warning events/11 years = .81 heat warning events annually;
    • 3 excessive heat watch event/11 years = .27 heat watch events annually

The National Academy of Sciences reported in 2012, that since 1950 the frequency and severity of heat waves has increased globally. In the United States, record high temperatures have outnumbered record low temperatures 2:1. Researchers have linked this trend to climate change. Human development is one cause of the increase in global temperatures. Transportation, industry, and utilities produce greenhouse gases that are emitted into the atmosphere. Some greenhouse gases have heat-trapping abilities that capture sunlight that enters into the atmosphere and prevents it from reflecting out.

Climate Change Projections on Heat Indices from Climate Tool Box

Overall, the probability of an extreme heat event occurring in the BRADD Region is occasional due to past events and the impacts of climate change; and as outlined using the classification definitions from FEMA.

This dashboard below displays the indemnity amount, which represents the dollar amount of yield loss due to heat. The dashboard also shows the number of acres that were impacted by heat.

As outlined by the Environmental Protection Agency, the built environment – pavement, roads, and other infrastructure – absorb and re-emit the sun’s heat more than the natural environment – forests and bodies of water. Therefore, areas with dense development tend to be hotter than outlying areas. In urban areas, daytime temperatures can be 1-7 degrees Fahrenheit hotter during the day than outlying areas and 2-5 degrees hotter at night (EPA Heat Island Effect). BRADD’s Counties do not contain major urban centers; however, they do contain smaller urban areas, which are more likely to experience hotter temperatures as shown in the maps linked below. BRADD uses the Trust for Public Land’s urban heat island severity map to show heat island locations in the BRADD region. Please note that due to technical constraints, the map is zoomed into BRADD’s Counties but contains data for the entire U.S. 

Highways are roads are damaged by excessive heat. Asphalt roads soften. Stress is placed on automobile cooling systems, diesel trucks, and railroad locomotives. This leads to an increase in mechanical failures. The demand for water increases during periods of hot weather. In extreme heat waves, water is used to cool bridges and other metal structures susceptible to heat failure, which causes a reduced water supply and pressure in many areas. This can significantly contribute to fire suppression problems for both urban and rural fire departments.

Various sectors of the agricultural community are affected by extreme heat. Milk production and cattle reproduction decreases during heat waves. Wheat, rice, maize, potato, and soybean crop yields can all be significantly reduced by extreme high temperatures at key development states.

The rise in water temperature during heat waves contributes to the degradation of water quality and negatively impacts fish populations. It can also lead to the death of other organisms in the water ecosystem. High temperatures are linked to rampant algae growth, causing fish kills in rivers and lakes.
People
Heat is the number one weather-related killer in the United States. Heat related illnesses include: fatigue, dehydration, heat exhaustion, and heat stroke. Statistical data from the National Weather Service shows that heat causes more fatalities per year than floods, lightning, tornadoes, and hurricanes combined.

Economy
Cost of replacing utility infrastructure that is damaged during the heat wave; lost revenue from agriculture

Climate change models predict and increase in overall temperature globally for the coming decades, including the BRADD region. With a potential rise of several degrees Fahrenheit, multiple services, systems, and activities face disruption and impact. Temperature increases this small may not seem threatening, but the cumulative impacts will affect weather events, human health, and ecosystem functions, along with economic and social issues related to energy use and cost of living.

Click the county names below to review vulnerability analysis by county. Overall vulnerability is defined using the classification definitions from FEMA.

On average, Allen County experienced 34.6 extreme heat days per year between 2010 and 2016.

Because of these factors, Allen County experiences moderate to high vulnerability to extreme heat events. Scottsville reflects Allen County’s overall history of extreme heat, and therefore experiences moderate to high vulnerability as well.
On average, Barren County experienced 27.9 extreme heat days per year between 2010 and 2016.

Because of these factors, Barren County experiences moderate vulnerability to extreme heat events. Cave City, Glasgow, and Park City reflect Barren County’s overall history of extreme heat, and therefore experience moderate vulnerability as well.
On average, Butler County experienced 41.7 extreme heat days per year between 2010 and 2016.

Because of these factors, Butler County experiences high vulnerability to extreme heat events. Morgantown, Rochester, and Woodbury reflect Butler County’s overall history of extreme heat, and therefore experience high vulnerability as well.
On average, Edmonson County experienced 32.4 extreme heat days per year between 2010 and 2016.

Because of these factors, Edmonson County experiences moderate to high vulnerability to extreme heat events. Brownsville reflects Edmonson County’s overall history of extreme heat, and therefore experiences moderate to high vulnerability as well.
On average, Hart County experienced 27.7 extreme heat days per year between 2010 and 2016.

Because of these factors, Hart County experiences moderate vulnerability to extreme heat events. Bonnieville, Horse Cave, and Munfordville reflect Hart County’s overall history of extreme heat, and therefore experience moderate vulnerability as well.
On average, Logan County experienced 40.4 extreme heat days per year between 2010 and 2016.

Because of these factors, Logan County experiences high vulnerability to extreme heat events. Adairville, Auburn, Lewisburg, and Russellville reflect Logan County’s overall history of extreme heat, and therefore experience high vulnerability as well.
On average, Metcalfe County experienced 22.6 extreme heat days per year between 2010 and 2016.

Because of these factors, Metcalfe County experiences moderate vulnerability to extreme heat events. Edmonton reflects Metcalfe County’s overall history of extreme heat, and therefore experiences moderate vulnerability as well.
On average, Monroe County experienced 24 extreme heat days per year between 2010 and 2016.

Because of these factors, Monroe County experiences moderate vulnerability to extreme heat events. Fountain Run, Gamaliel, and Tompkinsville reflect Monroe County’s overall history of extreme heat, and therefore experience moderate vulnerability as well.
On average, Simpson County experienced 36.7 extreme heat days per year between 2010 and 2016.

Because of these factors, Simpson County experiences moderate to high vulnerability to extreme heat events. Franklin reflects Simpson County’s overall history of extreme heat, and therefore experiences moderate to high vulnerability as well.
On average, Warren County experienced 38.1 extreme heat days per year between 2010 and 2016.

Because of these factors, Warren County experiences high vulnerability to extreme heat events. Bowling Green, Oakland, Plum Springs, Smiths Grove, and Woodburn reflect Warren County’s overall history of extreme heat, and therefore experience high vulnerability as well.