Earthquake

An earthquake is a geologic event that involves sudden, rapid shaking of the Earth caused by the breaking and shifting of rock beneath the Earth’s surface. Earthquakes can affect hundreds of thousands of square kilometers, causing damage to property, resulting in loss of life and injury, and disrupting the social and economic functioning of the affected area.

Ground motion, the movement of the earth’s surface during earthquakes or explosions, is the mechanism for most of the damage during an earthquake. Produced by waves generated by a sudden slip on a fault or sudden pressure at the unstable source, ground motion travels through the earth and along its surface. Ground motions are increased by soft soils overlying hard bedrock, referred to as ground motion amplification. Ground motion amplification can cause an excess amount of damage during an earthquake, even to sites very far from the epicenter. The level of damage depends on the amplitude and duration of the shaking, which are directly related to the earthquake size, the distance from the fault, the site and the regional geology.

Ground shaking from earthquakes can collapse buildings and bridges, disrupt gas, electric, and phone service, and sometimes trigger landslides, avalanches, flash floods, fires, and huge, destructive ocean waves (tsunamis). Buildings with foundations resting on unconsolidated landfill and other unstable soil, and trailers and homes not tied to their foundations are at risk because they can be shaken off their mountings during an earthquake. When an earthquake occurs in a populated area, it may cause deaths and injuries and extensive property damage.

Liquefaction occurs when strong earthquake shaking causes an immediate weakening of soils such that the soils take on properties similar to quicksand. Liquefaction most often occurs in artificial fill, and in highly saturated loose and sandy soils, such as low-lying coastal areas, lakeshores, and river valleys. Susceptibility to liquefaction is measured by the physical characteristics of a soil, such as grain, texture, compaction, and depth of groundwater. Soil liquefaction and intense ground shaking often cause the
most damage during an earthquake.

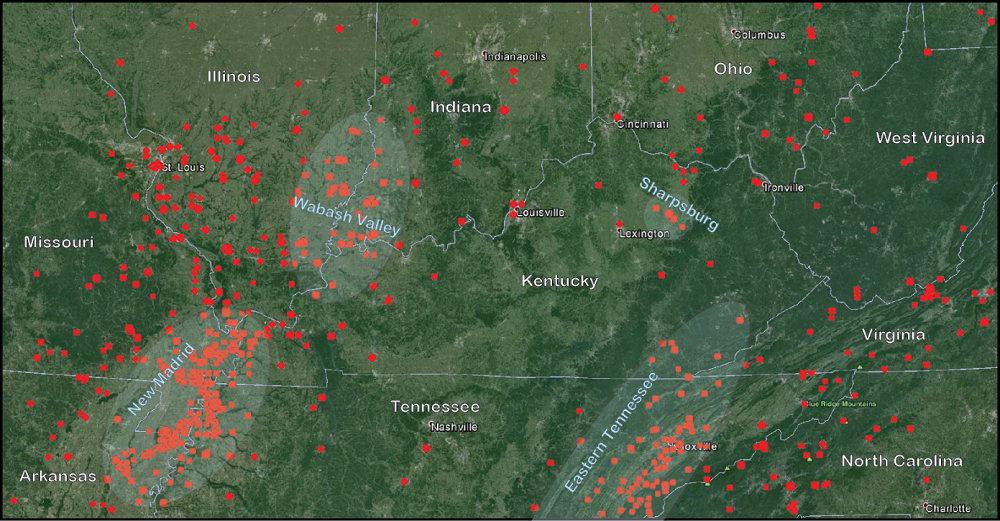
According to the Kentucky Geological Survey, the strongest historic earthquake recorded inside Kentucky’s borders was the magnitude 5.2 Sharpsburg earthquake of July 27, 1980, in Bath County. The quake caused an estimated $3 million in damage in Maysville. The 2012 Perry County earthquake (magnitude 4.2) caused minor damage to the Letcher County Courthouse in southeastern Kentucky. The most significant earthquakes to have affected Kentucky occurred from December 1811 to February 1812 in the New Madrid Seismic Zone. At least three large earthquakes, each estimated to have been greater than magnitude 7, occurred during that period. Though the state was sparsely settled then, these earthquakes affected the whole commonwealth. The New Madrid Seismic Zone is the most active seismic zone in the central and eastern United States, and a repeat of earthquakes with the same magnitude as the 1811-12 earthquakes could cause significant damage in Kentucky.

Although predicting earthquakes is impossible, the potential damage they cause can be mitigated through earthquake-resistant measures, such as codes for buildings, homes, and infrastructure. The Kentucky Building and Residential Codes were developed from a complicated process that started with a group of engineers, seismologists, and others using the national seismic hazard maps developed by the U.S. Geological Survey and engineering science. The codes developed a set of recommendations, including design ground motions, for seismic regulations for new buildings and other structures. These recommendations were endorsed by the Federal Emergency Management Agency and thus became federal policy, along with associated regulations for seismic safety. The recommendations were then adopted by state government agencies, as well as nongovernmental organizations such as the International Building Code Council.

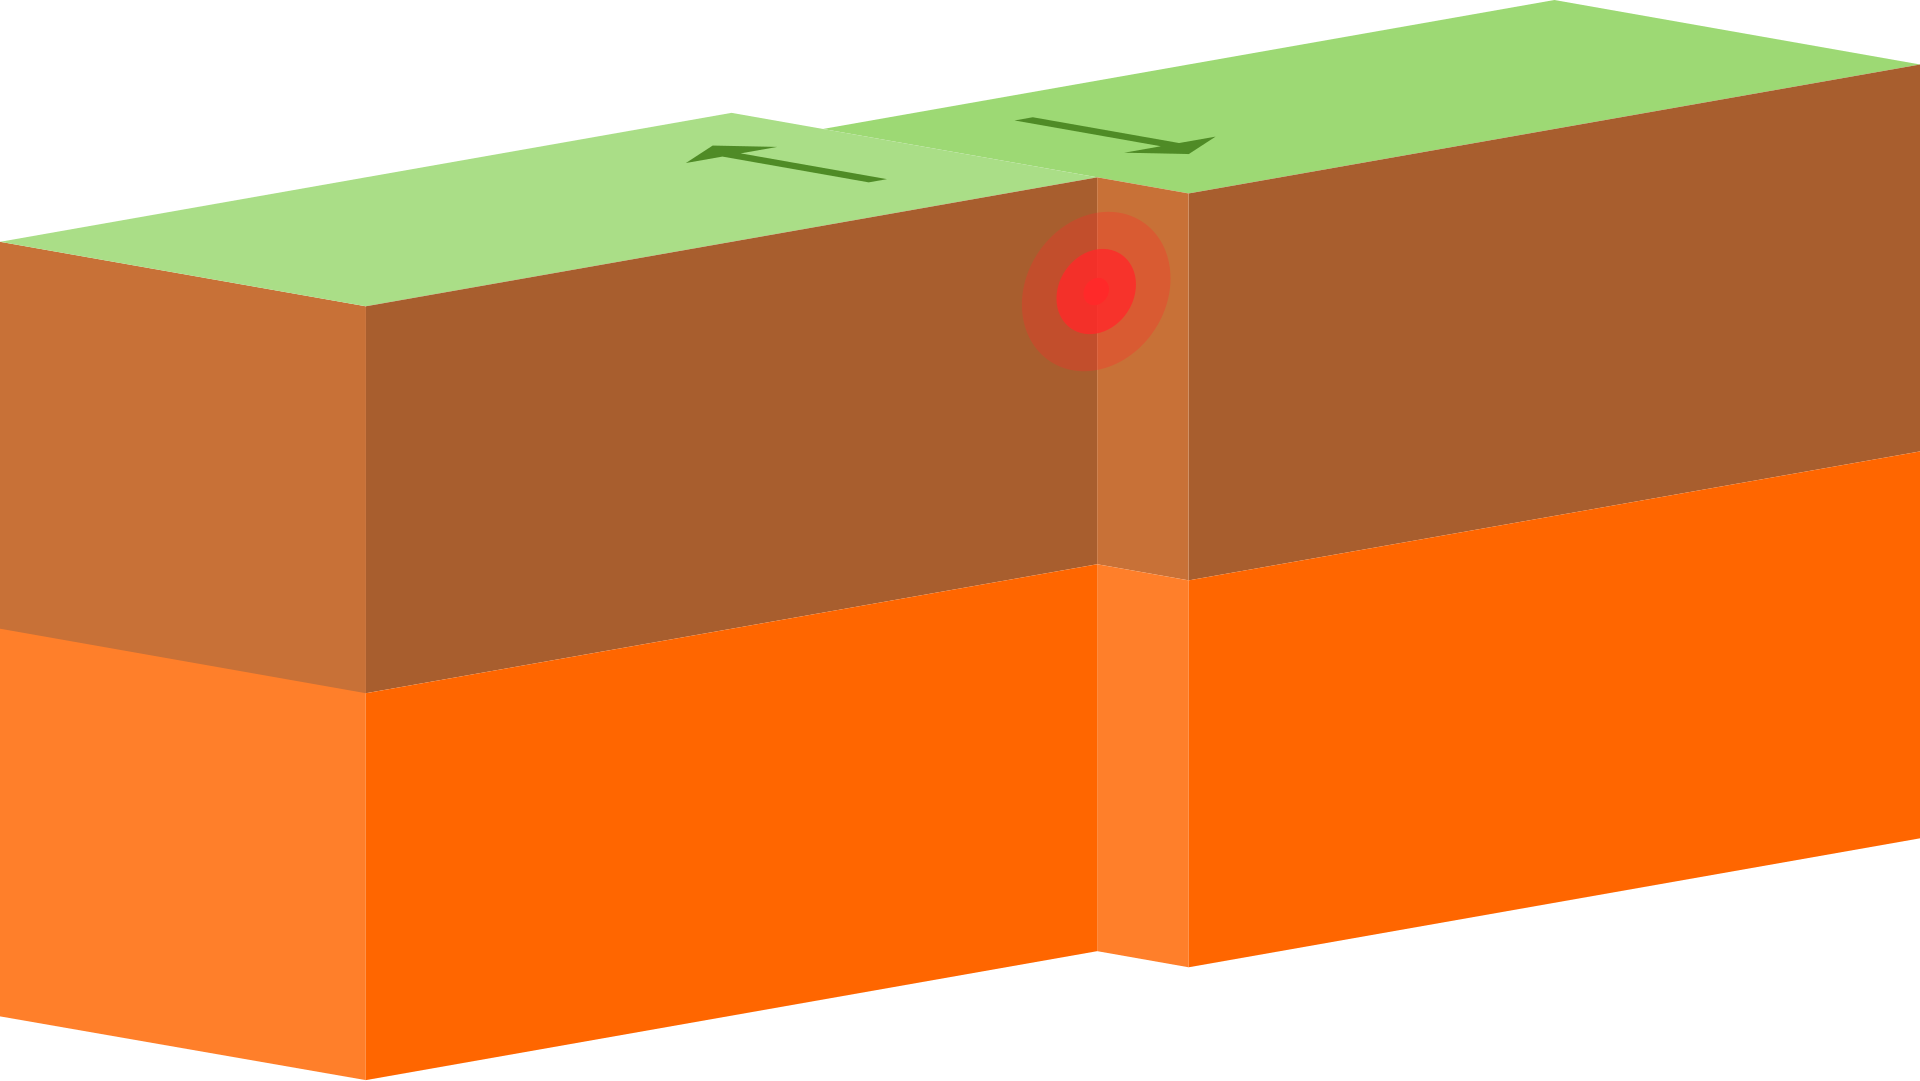
Types of Fault Lines

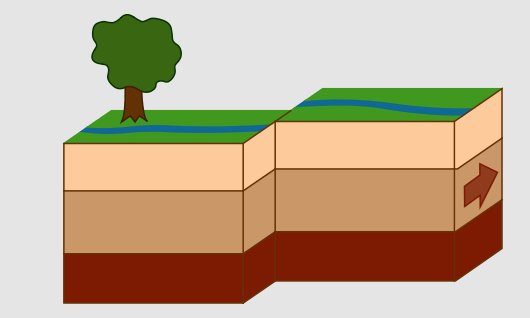
Strike-slip faults have walls that move sideways, not up or down. That is, the slip occurs along the strike, not up or down the dip. In these faults the fault plane is usually vertical, so there is no hanging wall or footwall. The forces creating these faults are lateral or horizontal, carrying the sides past each other. Strike-slip faults are either right-lateral or left-lateral. That means someone standing near the fault trace and looking across it would see the far side move to the right or to the left, respectively. The one in the picture is left-lateral.
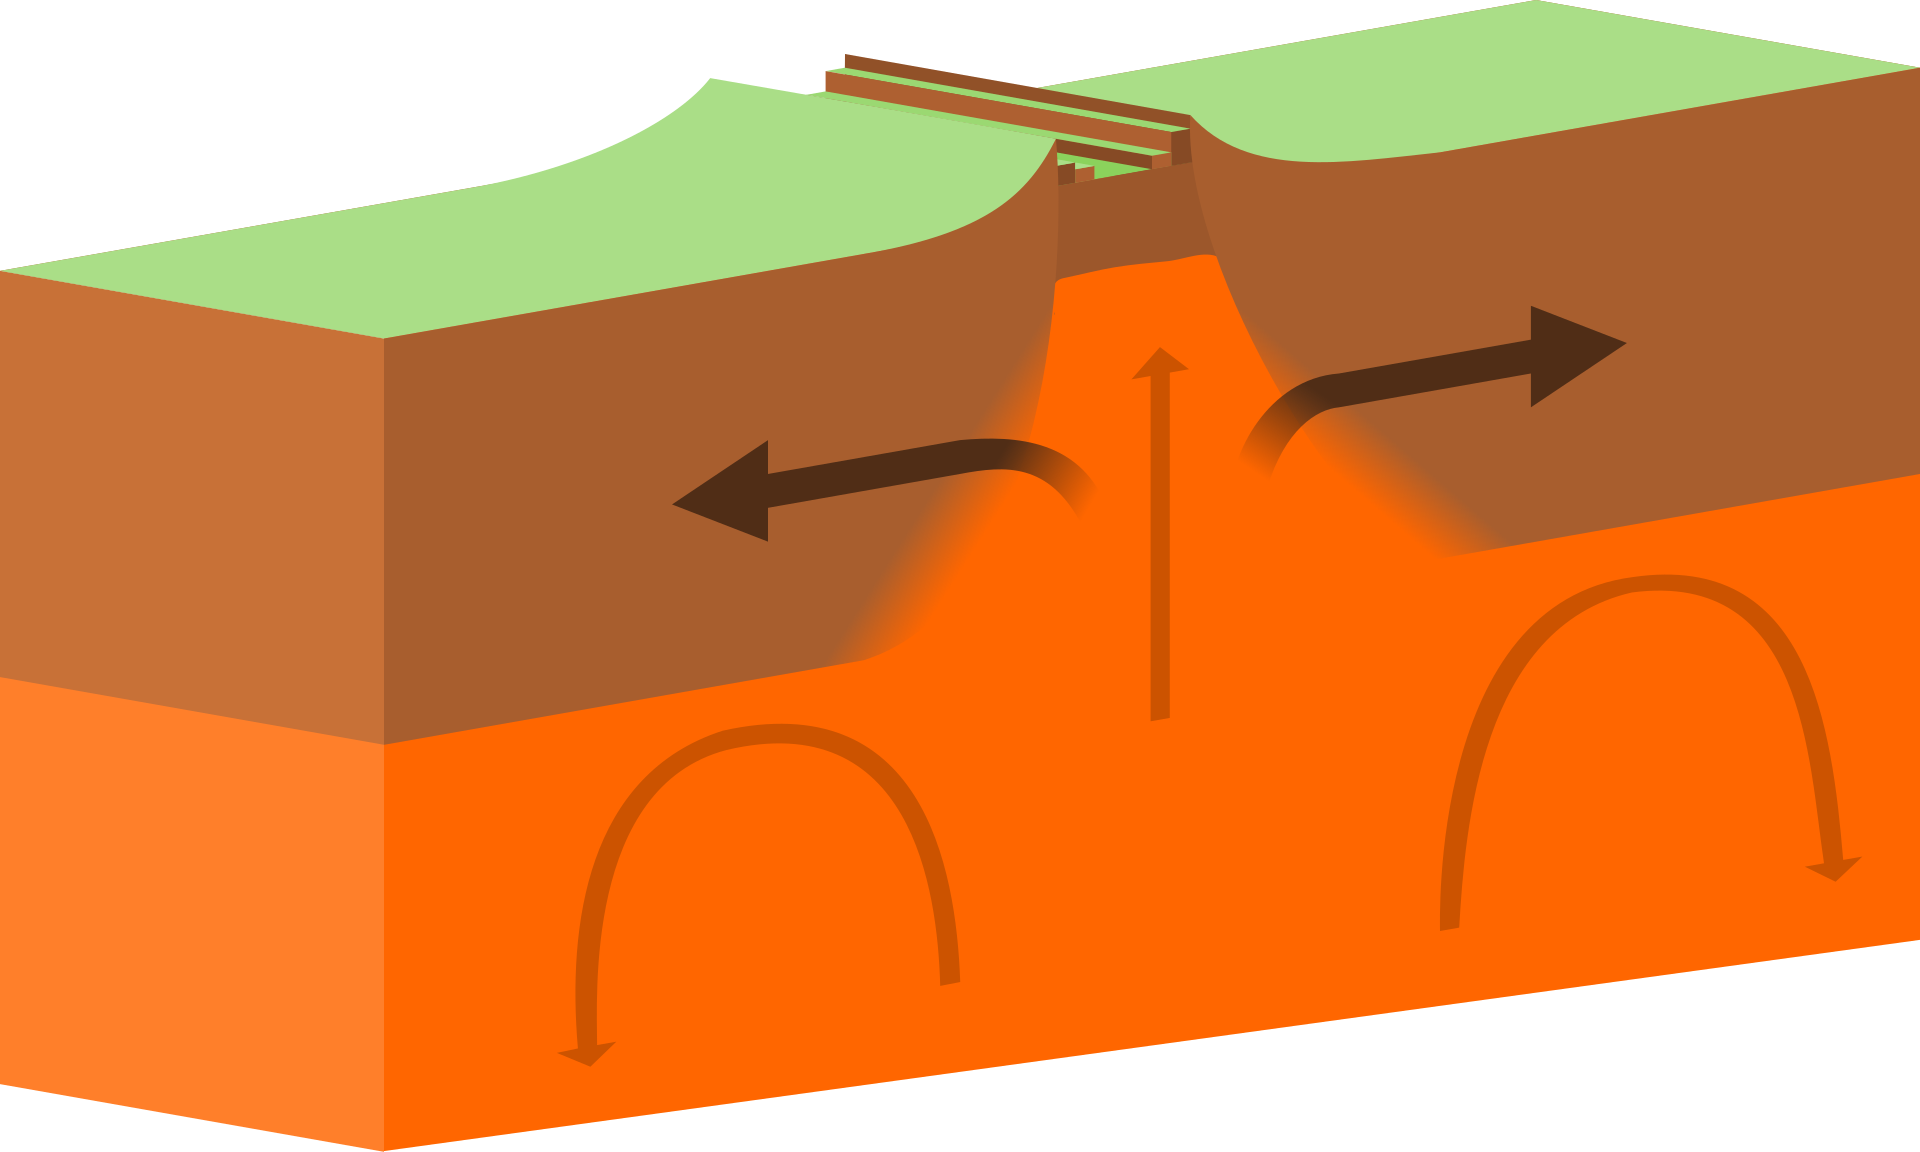
Normal faults form when the hanging wall drops down. The forces that create normal faults are pulling the sides apart, or extensional.
Thrust faults form when the hanging wall moves up. The forces creating thrust faults are compressional, pushing the sides together.

Types of Boundaries

Convergent/Destructive Plate Boundary – occurs when the two plate boundaries meet and one plate moves underneath the other.
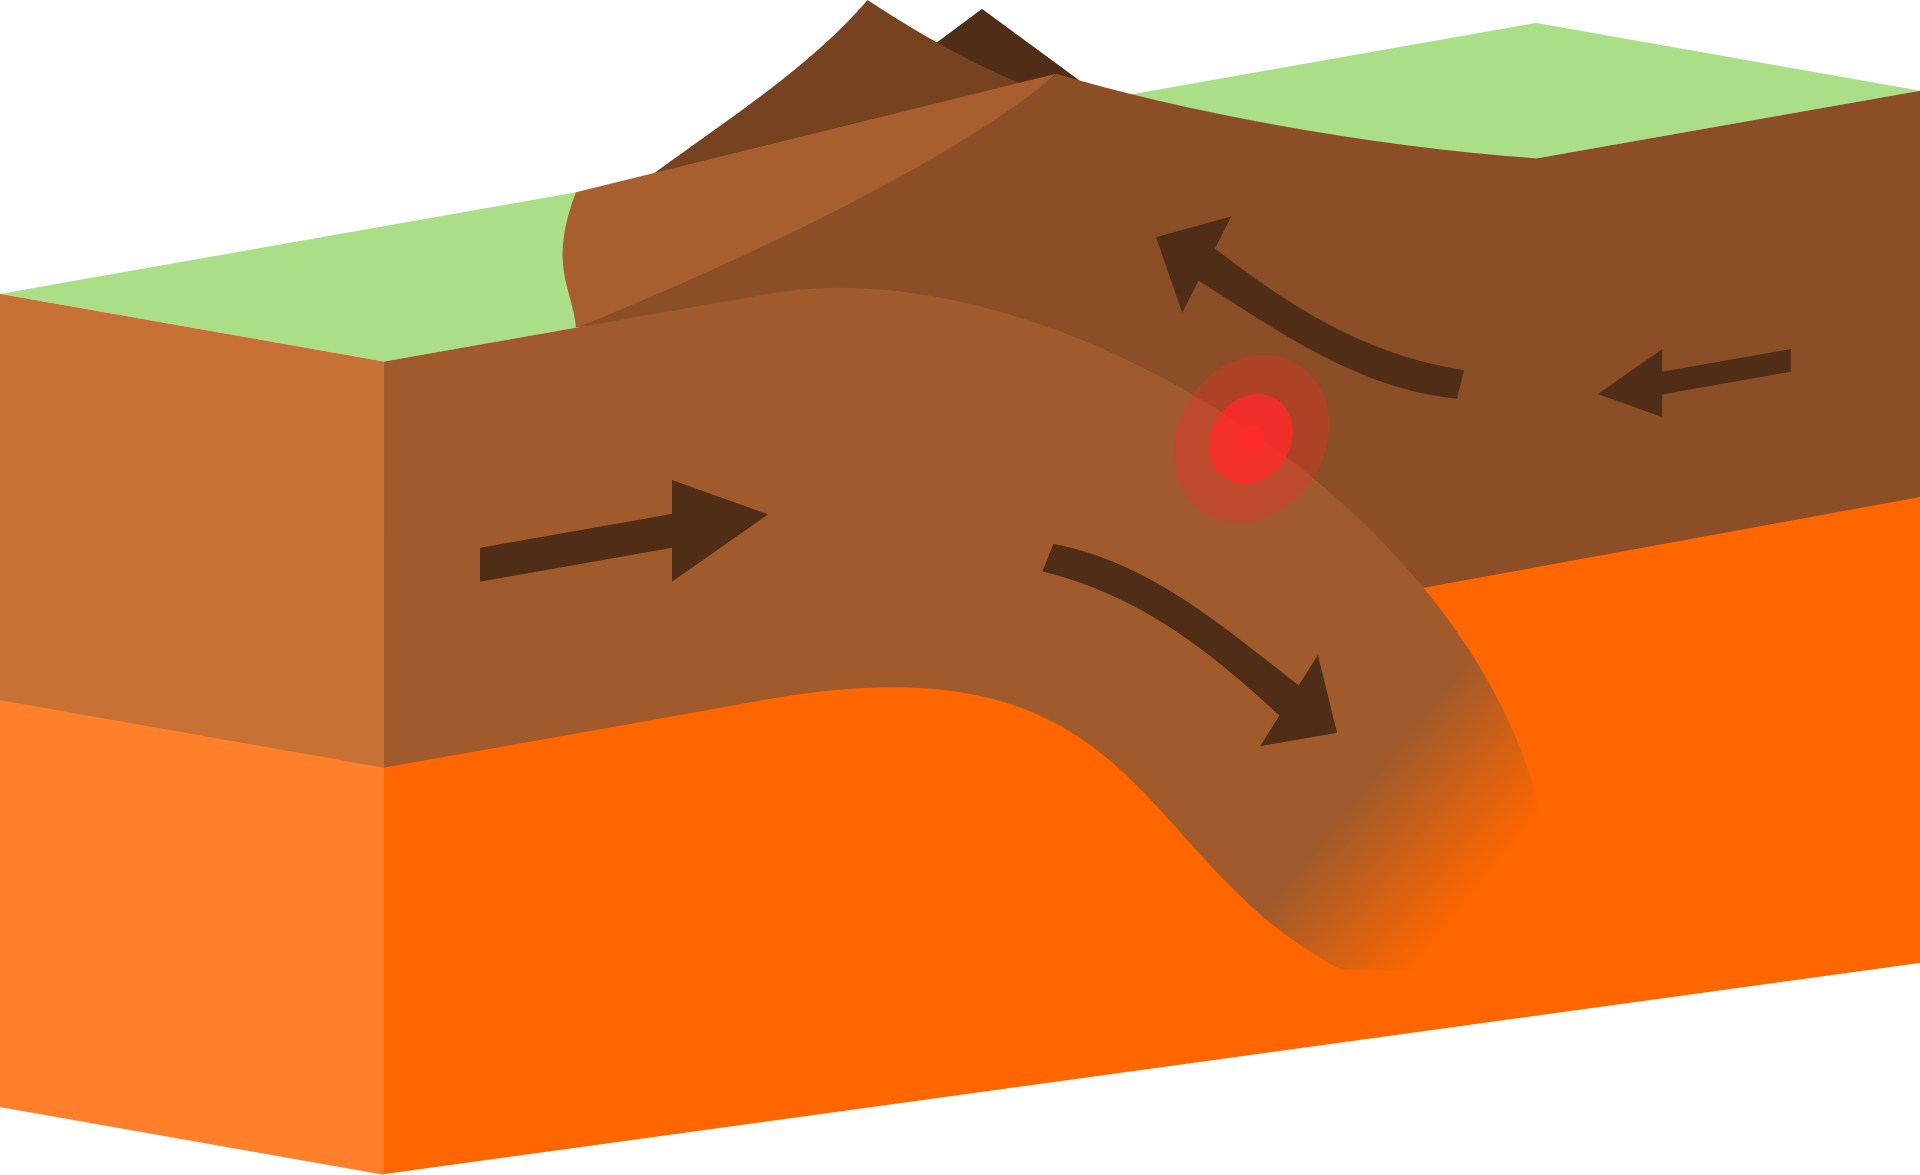
Divergent/Constructive Plate Boundary – occurs when the two plates’ boundaries are moving away from one another forming new crust.
Transform Plate Boundary – occurs when two plates slide past one another. Earthquakes are measured in terms of magnitude and intensity using the Richter Scale and Modified Mercalli Scale of Earthquake Intensity.

The Richter magnitude scale measures an earthquake‘s magnitude using an open-ended logarithmic scale that describes the energy release of an earthquake through a measure of shock wave amplitude. The earthquake‘s magnitude is expressed in whole numbers and decimal fractions. Each whole number increase in magnitude represents a 10-fold increase in measured wave amplitude, or a release of 32 times more energy than the preceding whole number value.

The Modified Mercalli scale measures the effect of an earthquake on the Earth‘s surface. Composed of 12 increasing levels of intensity that range from unnoticeable shaking to catastrophic destruction, the scale is designated by Roman numerals. There is no mathematical basis to the scale; rather, it is an arbitrary ranking based on observed events. The lower values of the scale detail the manner in which the earthquake is felt by people, while the increasing values are based on observed structural damage. The intensity values are assigned after gathering responses to questionnaires administered to postmasters in affected areas in the aftermath of the earthquake.

Modified Mercalli Intensity Scale with Corresponding Richter Scale

Intensity Verbal Description Witness Observation Maximum Acceleration (cm/sec2) Corresponding Richter Scale
I Instrumental Detectable on Seismographs <1 <3.5
II Feeble Felt by Some People <2.5 3.5
III Slight Felt by Some People Resting <5 4.2
IV Moderate Felt by People Walking <10 4.5
V Slightly Strong Sleepers Awake; Church Bells Ringing <25 <4.8
VI Strong Trees Sway; Suspended Objects Swing; Objects Fall off Shelves <50 4.8
VII Very Strong Mild Alarm; Walls Crack; Plaster Falls <100 6.1
VIII Destructive Moving Cars Uncontrollable; Masonry Fractures; Poorly Constructed Buildings Damaged <250
IX Runious Some Houses Collapse; Ground Cracks; Pipes Break Open <500 6.9
X Disastrous Ground Cracks Profusely; Many Buildings Destroyed; Liquefaction and Landslides Widespread <750 7.3
XI Very Disastrous Most Buildings and Bridges Collapse; Roads, Railways, Pipes, and Cables Destroyed; General Triggering of Other Hazards <980 8.1

Kentucky has a variety of fault systems across the State. The two that affect Kentucky the most are in adjacent states: the New Madrid in Missouri and the Wabash in Indiana.

The New Madrid Seismic Zone (NMSZ), located in the central Mississippi Valley, is generally demarked on the north by the confluence of the Ohio and Mississippi Rivers. From this point in southern Illinois, the zone runs southwest, through western Kentucky (near Fulton), through eastern Missouri and western Tennessee and terminates in northeastern Arkansas, crossing the Mississippi River 3 times.

The Wabash Valley Seismic Zone which threatens southern Illinois, Indiana, and Kentucky, shows evidence of large earthquakes in its geologic history. Since 1895, The Wabash Valley Fault Zone has experienced more moderate quakes than the New Madrid Seismic Zone. Some prehistoric quakes which occurred in this zone between 4,000 and 10,000 years ago may have been larger than M6.0. Earthquake ground shaking is amplified by lowland soils, and modern earthquakes of M5.5 to 6.0 in the Wabash Valley Fault Zone could cause substantial damage if they occur close to the populated river towns and cities along the Wabash River and tributaries.

Eastern Tennessee Seismic Zone which extends from southwest Virginia to northeast Alabama, is one of the most active earthquake areas in the Southeast. Although the zone has not had a large earthquake in historic times, a few earthquakes have caused slight damage. The largest recorded earthquake in this seismic zone was a magnitude 4.6 that occurred in 1973 near Knoxville. Sensitive seismographs have recorded hundreds of earthquakes too small to be felt in this seismic zone. Small, non-damaging, felt earthquakes occur about once a year. No evidence for larger prehistoric shocks have been discovered, yet the micro earthquake data suggest coherent stress accumulation within a large volume. Physical processes for reactivation of basement faults in this region could involve a weak lower crust and/or increased fluid pressures within the upper to middle crust.

Of particular concern to the residents of the BRADD region is the New Madrid Seismic Zone, which is located in Southeastern Missouri, Northeastern Arkansas, Western Tennessee, Western Kentucky, and Southern Illinois. It is the most active seismic zone in the United States east of the Rocky Mountains.

The image above depicts earthquakes with magnitude greater than 3, as indicated by red dots, and seismic zones (shaded areas) in and around Kentucky.
Source: https://www.uky.edu/KGS/earthquake/earthquake_matters.php

While there are tremors of the New Madrid Seismic Zone on a nearly daily basis, the largest magnitude earthquakes on the fault line in relatively recent history occurred between 1811 and 1812. Three large earthquakes ranging between 7.5 and 8 on the Richter scale caused numerous deaths and massive damage to structures. Documents from the time report tremors as far away as Washington D.C. and dramatic effects on the land, including cracks opening in the earth’s surface and the ground rolling in visible waves.

The map below is from the state of Kentucky’s 2018 Hazard Mitigation Plan. It demonstrates the median peak ground acceleration on rock from a magnitude 7.5 scenario earthquake in the New Madrid Seismic Zone. Peak ground acceleration  quantitatively measures ground motion.

The BRADD region does have some minor fault lines and has experienced 4 earthquakes with a magnitude of 3+ on the Richter scale. These fault lines and historic earthquake locations are shown on the map below. 

Built Environment
The manmade environment, including built structures and infrastructures is vulnerable to earthquakes. There will be a significant amount of damages to property and environment in addition to the disruption of lifeline facilities after an earthquake.

Natural Environment
The vulnerability to the natural environment primarily stems from secondary hazards such as liquefaction or other soil failure, landslides, fires, and hazardous materials spills. See information regarding specific hazard vulnerabilities for fires, landslides and hazardous material spills in their appropriate sections.

Social Environment
An earthquake will cause a great deal of damage to the transportation systems. The roads may be covered by debris or be affected by secondary hazards such as landslides or fires. The bridges are particularly vulnerable to collapse. During a regional event, hospitals are likely to be overwhelmed from overflow from other regions.

Sanitation and water supply systems are vulnerable to damage or collapse from an earthquake, particularly if they are located in the liquefaction zones. Communication systems may be compromised as a result of downed electric and telephone lines, damage to cell phone towers, or overuse of the system immediately following an event. Compromised communication systems will make it difficult for people to report damages or call for assistance.

In a report filed in November 2008, The U.S. Federal Emergency Management Agency warned that a serious earthquake in the New Madrid Seismic Zone could result in "the highest economic losses due to a natural disaster in the United States," further predicting "widespread and catastrophic" damage across Alabama, Arkansas, Illinois, Indiana, Kentucky, Mississippi, Missouri and particularly Tennessee, where a 7.7 magnitude quake or greater would cause damage to tens of thousands of structures affecting water distribution, transportation systems, and other vital infrastructure. The earthquake is expected to also result in many thousands of fatalities

Populations at Risk
Hazard Specific
People inside or near buildings that suffer structural damage during an earthquake may become injured or trapped. People in areas of higher density are more vulnerable to falling debris due to lack of open spaces to escape unsafe structures.

Isolated Population
Road blockage or damage may cause local neighborhoods to become isolated. Isolation will decrease the availability of emergency services and access to vital necessities like food and water.

Children
An earthquake during school hours may separate children from their families. Children may have limited transportation options when attempting to reunite with their parents.

Elderly
People with limited mobility or transportation options are more likely to become isolated in their homes. Those that rely on electrically powered medical devices are particularly vulnerable to power outages.

Limited English Language
Language barriers may inhibit individuals from getting help from emergency services or limit their access to critical information.
Drought and heavy precipitation events can add stress on the rock potentially leading to fault impacts. If drought conditions require the pumping of groundwater for human consumption, there can also put stress on the rock leading to potential seismic activity.

The BRADD area has low risk of earthquakes, so climate change may not have much impact on an increase in severity or frequency.

Potential impacts include:
  • Infrastructure damage (roads, sidewalks, buildings)
  • Loss of life
  • Displacement

Scientists estimate that that there is a 25-40% probability of a 6.0 or higher magnitude earthquake within any 50-year period. Though Western Kentucky has not experienced any recent earthquakes that have caused major structural damage, the potential for such an event warrants local government, residents, and businesses within the BRADD region to take precaution and implement plans, procedures, and projects to mitigate the impact of a strong earthquake. It’s really not a question of if but when. Earthquakes can occur at any time of year and warning time is essentially non-existent.

From a historic data perspective, the following is true of the BRADD Region:

  • Allen County has experienced no earthquakes.
  • Barren County has experienced no earthquakes.
  • Butler County has experienced 5 earthquakes, 3 of which were ranked at a magnitude of 3.
  • Edmonson County has experienced 1 earthquake ranked at a magnitude of 3.
  • Hart County has experienced no earthquakes.
  • Logan County has experienced no earthquakes.
  • Metcalfe County has experienced no earthquakes.
  • Monroe County has experienced no earthquakes.
  • Simpson County has experienced no earthquakes.
  • Warren County has experiences no earthquakes.

Of the six historic earthquakes in the BRADD region, seven occurred in 1990, two occurred in 1987, one in 1983, and one in 1982. No historic event shows reports of damage.

Source: Wang, Z. (2010). Ground motion for the maximum credible earthquake in Kentucky: Kentucky Geological Survey, ser. 12, Report of Investigations 22.

The Geologic Hazards Section of the Kentucky Geological Survey operates and maintains the Kentucky Seismic and Strong-Motion Network, or KSSMN, which monitors earthquakes in and around the commonwealth. The network consists of 22 permanent seismic and strong-motion stations and eight temporary seismic stations. Fourteen earthquakes, with magnitudes ranging from 1.1 to 2.9, were located within the state between July 1, 2019, and June 30, 2020. The map below depicts locations of seismic stations in the Kentucky Seismic and Strong-Motion Network.

Overall, the BRADD Region experiences low vulnerability to an earthquake event.  To explore vulnerability by county, click the links below. Overall vulnerability is defined using the classification definitions from FEMA.

Earthquake Hazard Vulnerability Summary Analysis

  • Allen County is within the “light” perceived shaking zone for a high magnitude earthquake and does not contain significant fault lines.

Because of these factors, Allen County experiences low vulnerability to earthquakes. Because earthquakes are non-spatial hazards, it can be assumed that this analysis should be applied to Allen County’s respective city, Scottsville.
  • Barren County is within the “light” perceived shaking zone for a high magnitude earthquake and does not contain significant fault lines.

Because of these factors, Barren County experiences low vulnerability to earthquakes. Because earthquakes are non-spatial hazards, it can be assumed that this analysis should be applied to Barren County’s respective cities – Cave City, Glasgow, and Park City.
  • Butler County is within the “light” perceived shaking zone for a high magnitude earthquake and does not contain significant fault lines.

Because of these factors, Butler County experiences low vulnerability to earthquakes. Because earthquakes are non-spatial hazards, it can be assumed that this analysis should be applied to Butler County’s respective cities – Rochester, Morgantown, and Woodbury.
  • Edmonson County is within the “light” perceived shaking zone for a high magnitude earthquake and does not contain significant fault lines.

Because of these factors, Edmonson County experiences low vulnerability to earthquakes. Because earthquakes are non-spatial hazards, it can be assumed that this analysis should be applied to Edmonson County’s respective city – Brownsville.
  • Hart County is within the “light” perceived shaking zone for a high magnitude earthquake and does not contain significant fault lines.

Because of these factors, Hart County experiences low vulnerability to earthquakes. Because earthquakes are non-spatial hazards, it can be assumed that this analysis should be applied to Hart County’s respective cities – Bonnieville, Horse Cave, and Munfordville.
  • Logan County is within the “light” perceived shaking zone for a high magnitude earthquake and does not contain significant fault lines.

Because of these factors, Logan County experiences low vulnerability to earthquakes. Because earthquakes are non-spatial hazards, it can be assumed that this analysis should be applied to Logan County’s respective cities – Adairville, Auburn, Lewisburg, and Russellville.
  • Metcalfe County is within the “light” perceived shaking zone for a high magnitude earthquake and does not contain significant fault lines.

Because of these factors, Metcalfe County experiences low vulnerability to earthquakes. Because earthquakes are non-spatial hazards, it can be assumed that this analysis should be applied to Metcalfe County’s respective city – Edmonton.
  • Monroe County is within the “light” perceived shaking zone for a high magnitude earthquake and does not contain significant fault lines.

Because of these factors, Monroe County experiences low vulnerability to earthquakes. Because earthquakes are non-spatial hazards, it can be assumed that this analysis should be applied to Monroe County’s respective cities – Fountain Run, Gamaliel, and Tompkinsville.
  • Simpson County is within the “light” perceived shaking zone for a high magnitude earthquake and does not contain significant fault lines.

Because of these factors, Simpson County experiences low vulnerability to earthquakes. Because earthquakes are non-spatial hazards, it can be assumed that this analysis should be applied to Simpson County’s respective city – Franklin.
  • Warren County is within the “light” perceived shaking zone for a high magnitude earthquake and does not contain significant fault lines.

Because of these factors, Simpson County experiences low vulnerability to earthquakes. Because earthquakes are non-spatial hazards, it can be assumed that this analysis should be applied to Warren County’s respective cities – Bowling Green, Plum Springs, Oakland, Smiths Grove, and Woodburn.