Drought
Drought is generally defined as a deficiency in precipitation over an extended period of time which results in a scarcity of water that impacts related activities and groups. Droughts are caused by a lack of precipitation coupled with an increased demand on the water supply. The severity of a drought often depends upon social context. A drought could occur in two different years that are the same in length and dryness, but one drought may be more severe because the society is more vulnerable due to population pressures on the water supply.
Types of Drought
The Palmer Drought Severity Index is the most widely used measurement of drought severity. The following indicators demonstrate drought severity by comparing the level of recorded precipitation against the average precipitation for a region.
- A meteorological drought is defined by the degree of dryness and the duration of a period without precipitation.
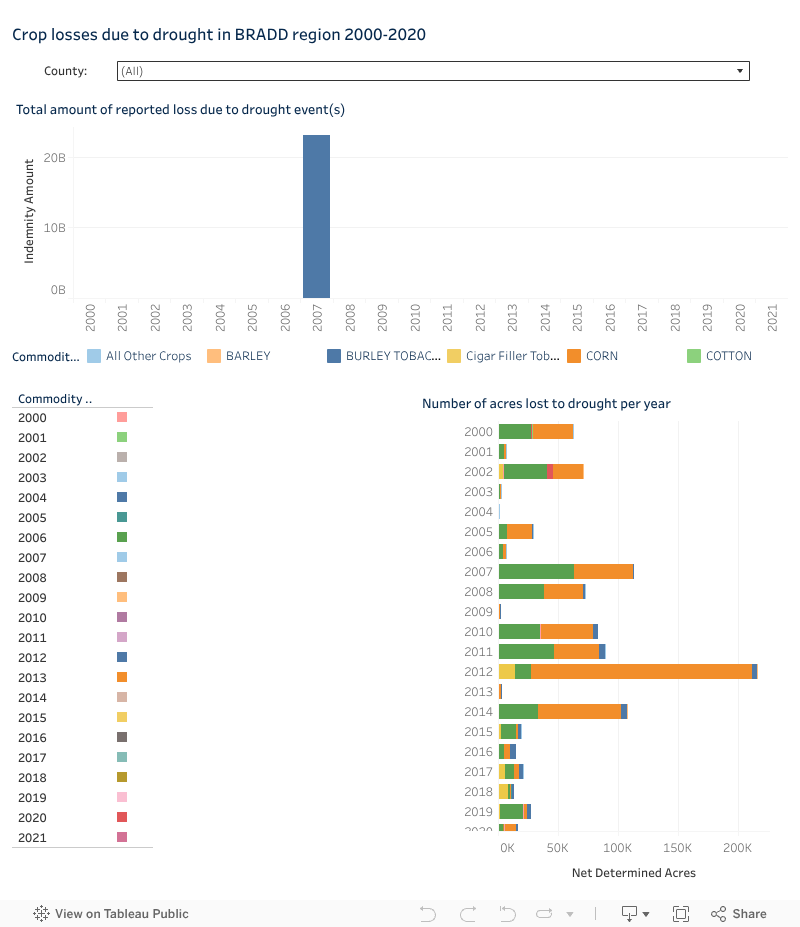
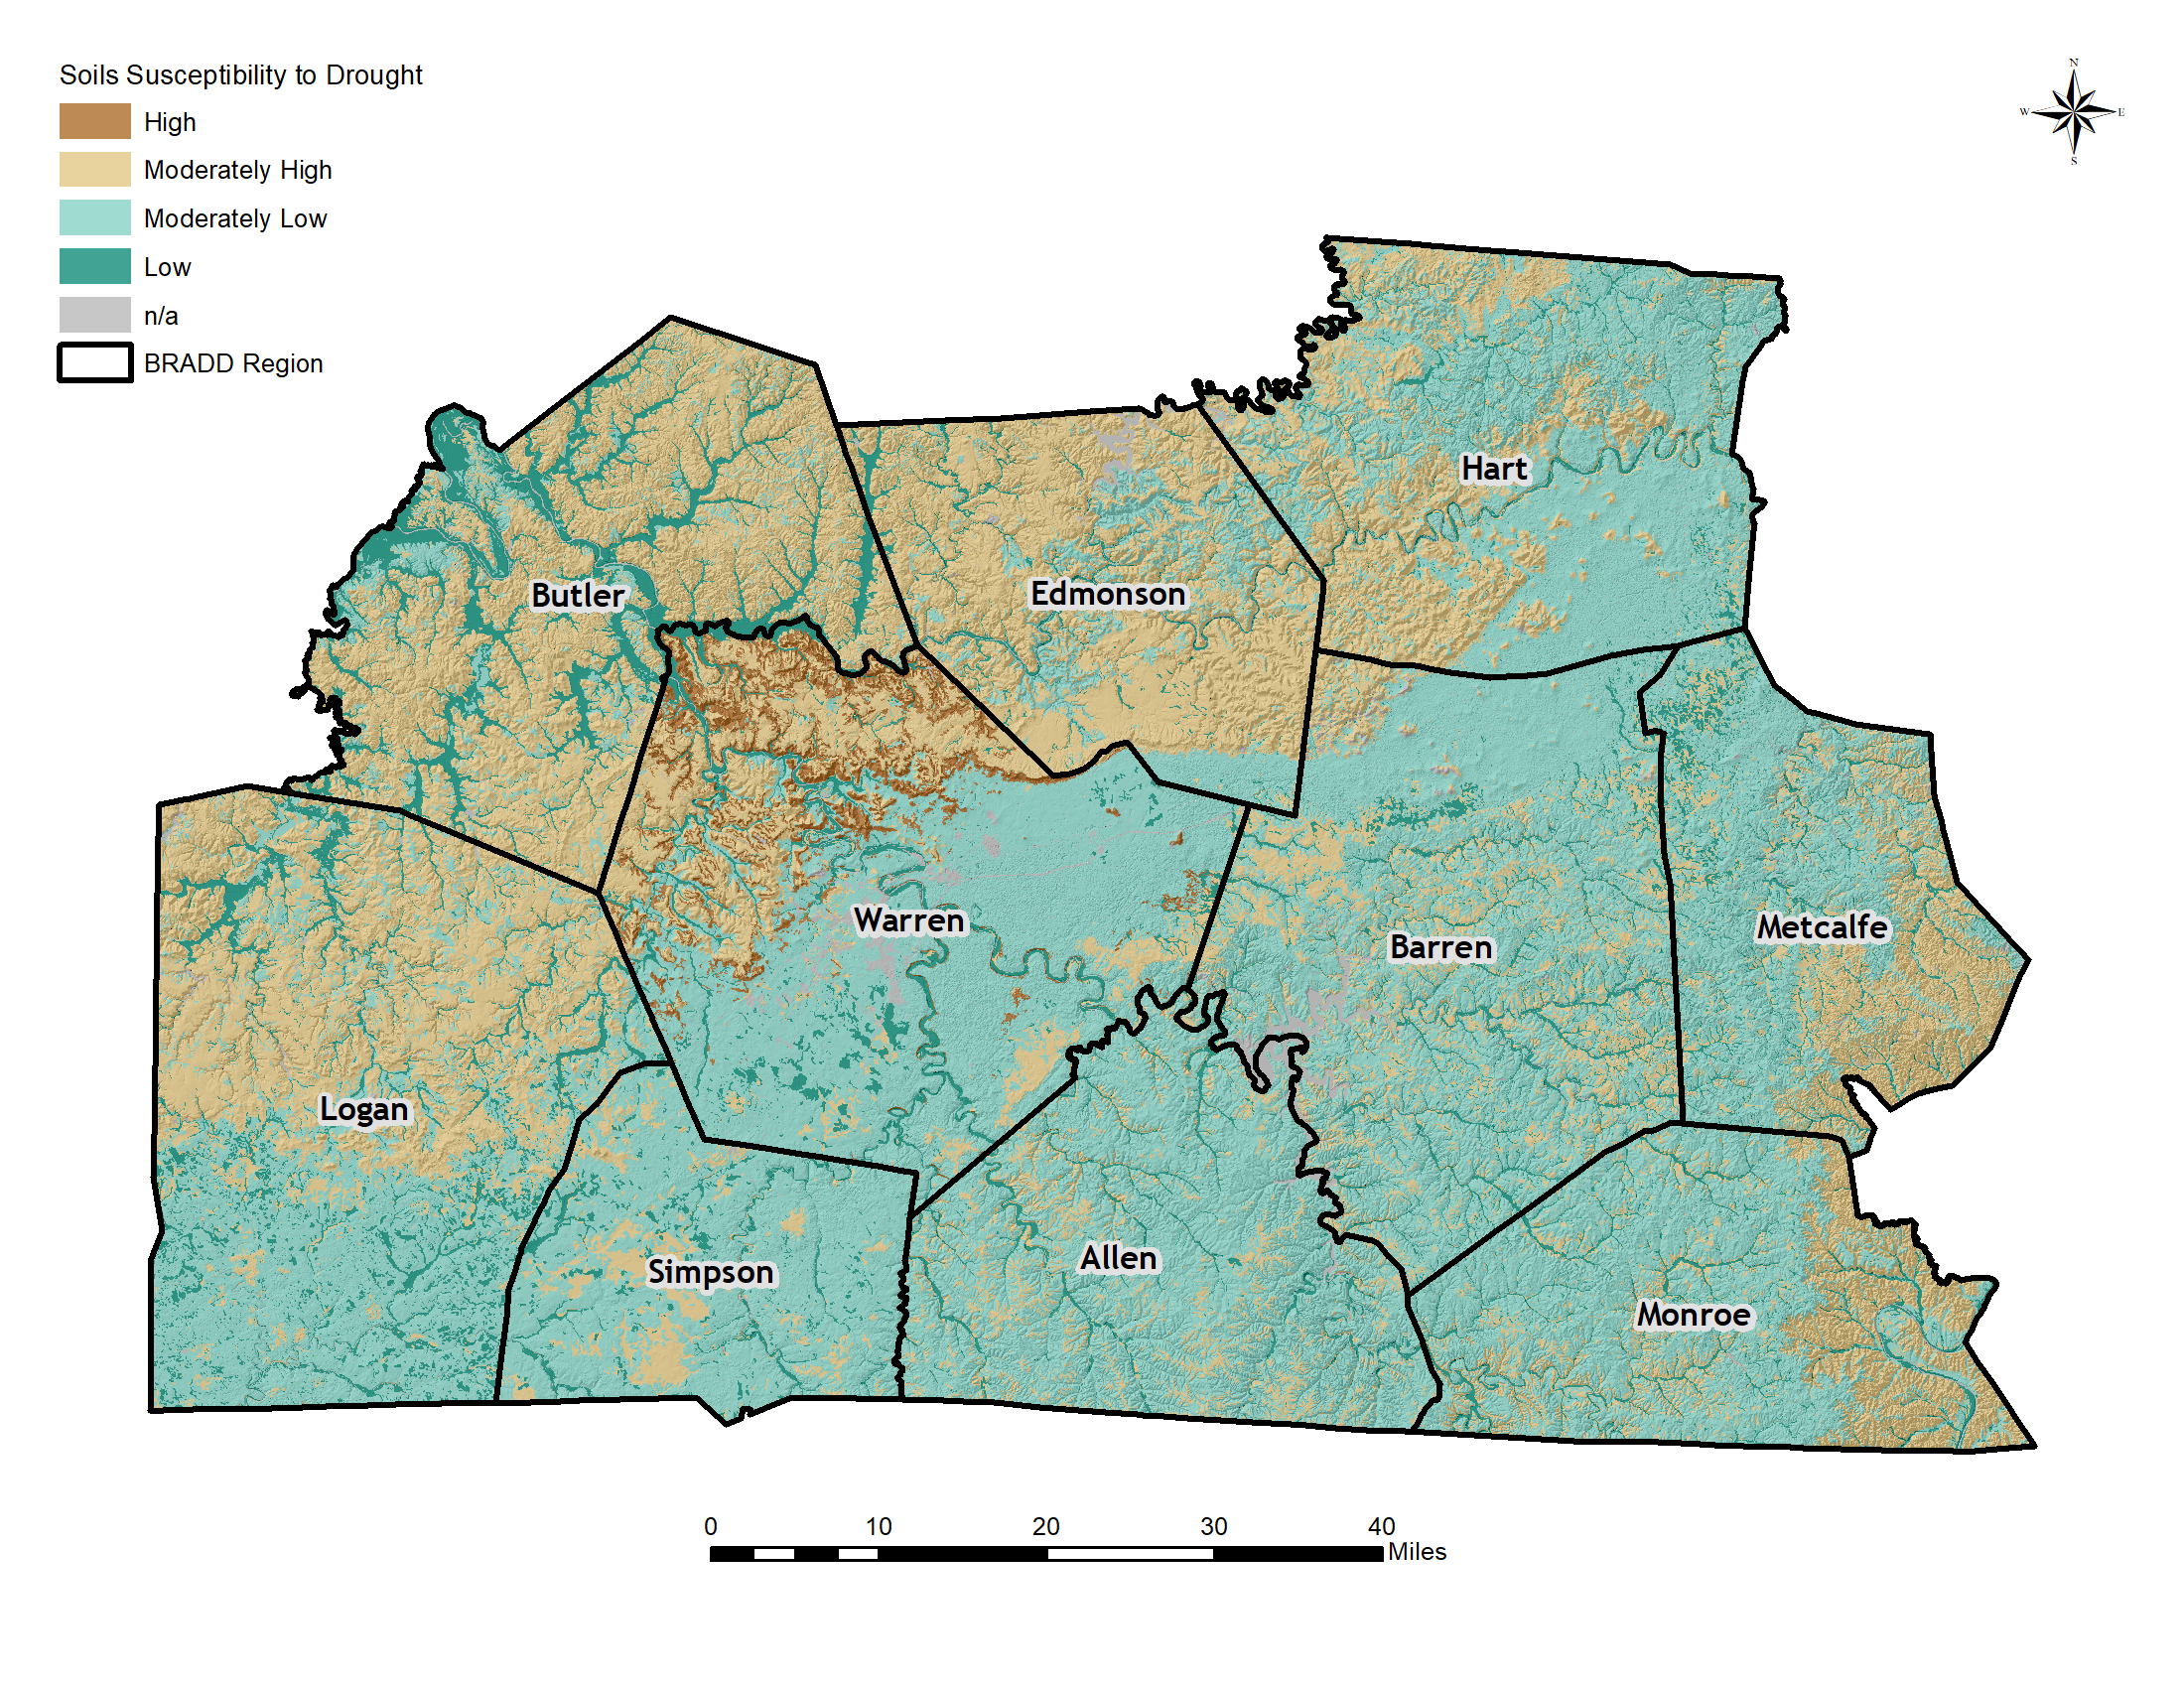
- Agricultural drought ties attributes of meteorological drought with agricultural impacts, often focusing on the amount of precipitation and evapotranspiration, which is the transference of water from the land to the atmosphere via evaporation. The magnitude of this type of drought is often conceptualized as the difference between plant water demand and available soil water. Because of this, the definition of agricultural drought accounts for the susceptibility of crops at the various stages of their development cycle
- Hydrological drought refers to below average water content in surface and subsurface water supply. This type of drought is generally out of phase with meteorological or agricultural drought.
- Socioeconomic drought focuses more on the social context that causes and intensifies drought conditions. This type of drought links meteorological, agricultural, and hydrological drought to supply and demand.
U.S. Drought Monitor
The U.S. Drought Monitor is one way to understand drought. Blending qualitative and quantitative data, it provides a weekly assessment of drought conditions across the U.S. It uses numeric inputs such as the Palmer Drought Severity Index, the Standardized Precipitation Index, and other climatological inputs; the Keech-Byram Drought Index for fire, satellite-based assessments of vegetation health, and various indicators of soil moisture; and hydrologic data, particularly in the West, such as the Surface Water Supply Index and snowpack. It also incorporates empirical evidence from 450 observers across the U.S. including state climatologists, National Weather Service staff, extension agents, and hydrologists.
A description of each category is available below:
Drought Classification
| Category | Description | Example Percentile Range for Most Indicators | Values for Standard Precipitation Index and Standardized Precipitation-Evapotranspiration Index |
| None | Normal or wet conditions | 30.01 or Above | -0.49 or above |
| D0 | Abnormally Dry | 20.01 to 30.00 | -0.5 to -0.79 |
| D1 | Moderate Drought | 10.01 to 20.00 | -0.8 to -1.29 |
| D2 | Severe Drought | 5.01 to 10.00 | -1.3 to -1.59 |
| D3 | Extreme Drought | 2.01 to 5.00 | -1.6 to -1.99 |
| D4 | Exceptional Drought | 0.00 to 2.00 | -2.0 or less |