Butler County
Community Profile
Butler County, located in south-central Kentucky within the Barren River Area Development District, encompasses approximately 431 square miles of primarily rural landscape. The Green River flows through the center of the county, joined by the Barren River at Woodbury—forming the heart of Butler’s geography, economy, and hazard profile. The county seat, Morgantown, serves as its population and service hub, with smaller incorporated communities in Rochester and Woodbury.
The county’s 12,000+ residents are distributed across a mix of agricultural lands, small towns, and river corridors. Transportation lifelines such as Interstate 165 (William H. Natcher Parkway) and U.S. 231 connect Butler County to Bowling Green and Owensboro, supporting economic activity and emergency access. The Green River’s historic locks and dams, now largely decommissioned or removed, reflect the county’s industrial heritage while also shaping ongoing floodplain management and recreational use.
Butler County’s natural setting defines both its opportunities and its risks. The Green and Barren rivers create fertile farmland and recreation assets but also pose flood and erosion hazards during heavy rainfall. The county is exposed to a full range of regional hazards—severe storms, tornadoes, flooding, winter weather, drought, and extreme temperatures—that can impact infrastructure, agriculture, and vulnerable populations. Ongoing participation in the National Flood Insurance Program (NFIP) and regional hazard mitigation planning helps the county strengthen its resilience and protect its residents, economy, and natural resources.
How Hazards are Examined
Each hazard in this multi-hazard multi-jurisdiction mitigation plan is examined through 6 specific lenses as required by FEMA. These include: the nature of the hazard, location, extent, historical occurrences, probability of future events, and impacts. Additionally, each participating jurisdiction reviews existing mitigation measures for each hazard, and creates additional mitigation actions to address any gaps.
Background:
A description of the hazard, including frequency, intensity, and duration
Location:
Geographic areas affected by the hazard; specific locations or features
Extent:
The severity or magnitude of the hazard
Past events:
Historical Occurrences involving the hazards
Probability of Future Events:
The likelihood of the hazard occurring in the future.
Impacts:
Potential consequences of the hazard both direct and indirect
Hazards in Butler County
Baseline Data
The following data points are used as baseline data to track trends across all 10 counties in the BRADD footprint. Data points are sourced from U.S. Census Bureau and 2019 American Community Survey 5-Year Estimates.
Dam Failure in Butler County
Dam Failure
Dam failure is the uncontrolled release of impounded water due to structural, mechanical, or hydraulic causes.
Types of Dams
There are two primary types of dams: embankment and concrete. Embankment dams are the most common and are constructed using either natural soil or rock or waste material from a mining or milling operation. They are often referred to as “earth-fill” or “rock-fill” based upon which of those two types of materials is used to compact the dam. Concrete dams are generally categorized as either gravity or buttress dams. Gravity dams rely on the mass of the concrete and friction to resist the water pressure. A buttress dam is a type of gravity dam where the large mass of concrete is reduced and the force of water pressure is “diverted to the dam foundation through vertical or sloping buttresses.”
The Energy and Environment Cabinet, authorized by KRS 151.293 Section 6 to inspect existing structures that meet the above definition of a dam, further notes three classifications of dams:
- High Hazard (C) – Structures located such that failure may cause loss of life or serious damage to houses, industrial or commercial buildings, important public utilities, main highways or major railroads.
- Moderate Hazard (B) – Structures located such that failure may cause significant damage to property and project operation, but loss of human life is not envisioned.
- Low Hazard (A) – Structures located such that failure would cause loss of the structure itself but little or no additional damage to other property.
High- and moderate-hazard dams are inspected every two years. Low-hazard dams are inspected every five years.

Quality of Dam Infrastructure
The American Society of Civil Engineers gave Kentucky a D+ on dam infrastructure, which is only slightly better than the national average. The average US dam is 60 years old, and most dams in Kentucky are over 50. As of 2019, 80 dams in the state are classified as two-fold risks, meaning that they are both high hazards and in poor or unsatisfactory condition. 47% of these 80 dams received that rating partially because they cannot hold enough rain during catastrophic storms. 89% of high hazard dams in Kentucky do not have complete emergency action plans on file with the state. 74% have simplified draft plans, but these are not widely shared and have not been adopted by local officials.
Types of Dam Failure
There are three types of Dam Failure:
- Structural: This common cause is responsible for nearly 30% of all dam failure in the United States. Structural failure of a dam occurs when there is a rupture in the dam or its foundation.
- Mechanical: Refers to the failure or malfunctioning of gates, conduits, or valves.
- Hydraulic: Occurs when the uncontrolled flow of water over the top, around, and adjacent to the dam erodes its foundation. Hydraulic failure is the cause of approximately 34% of all dam failures.
Extent
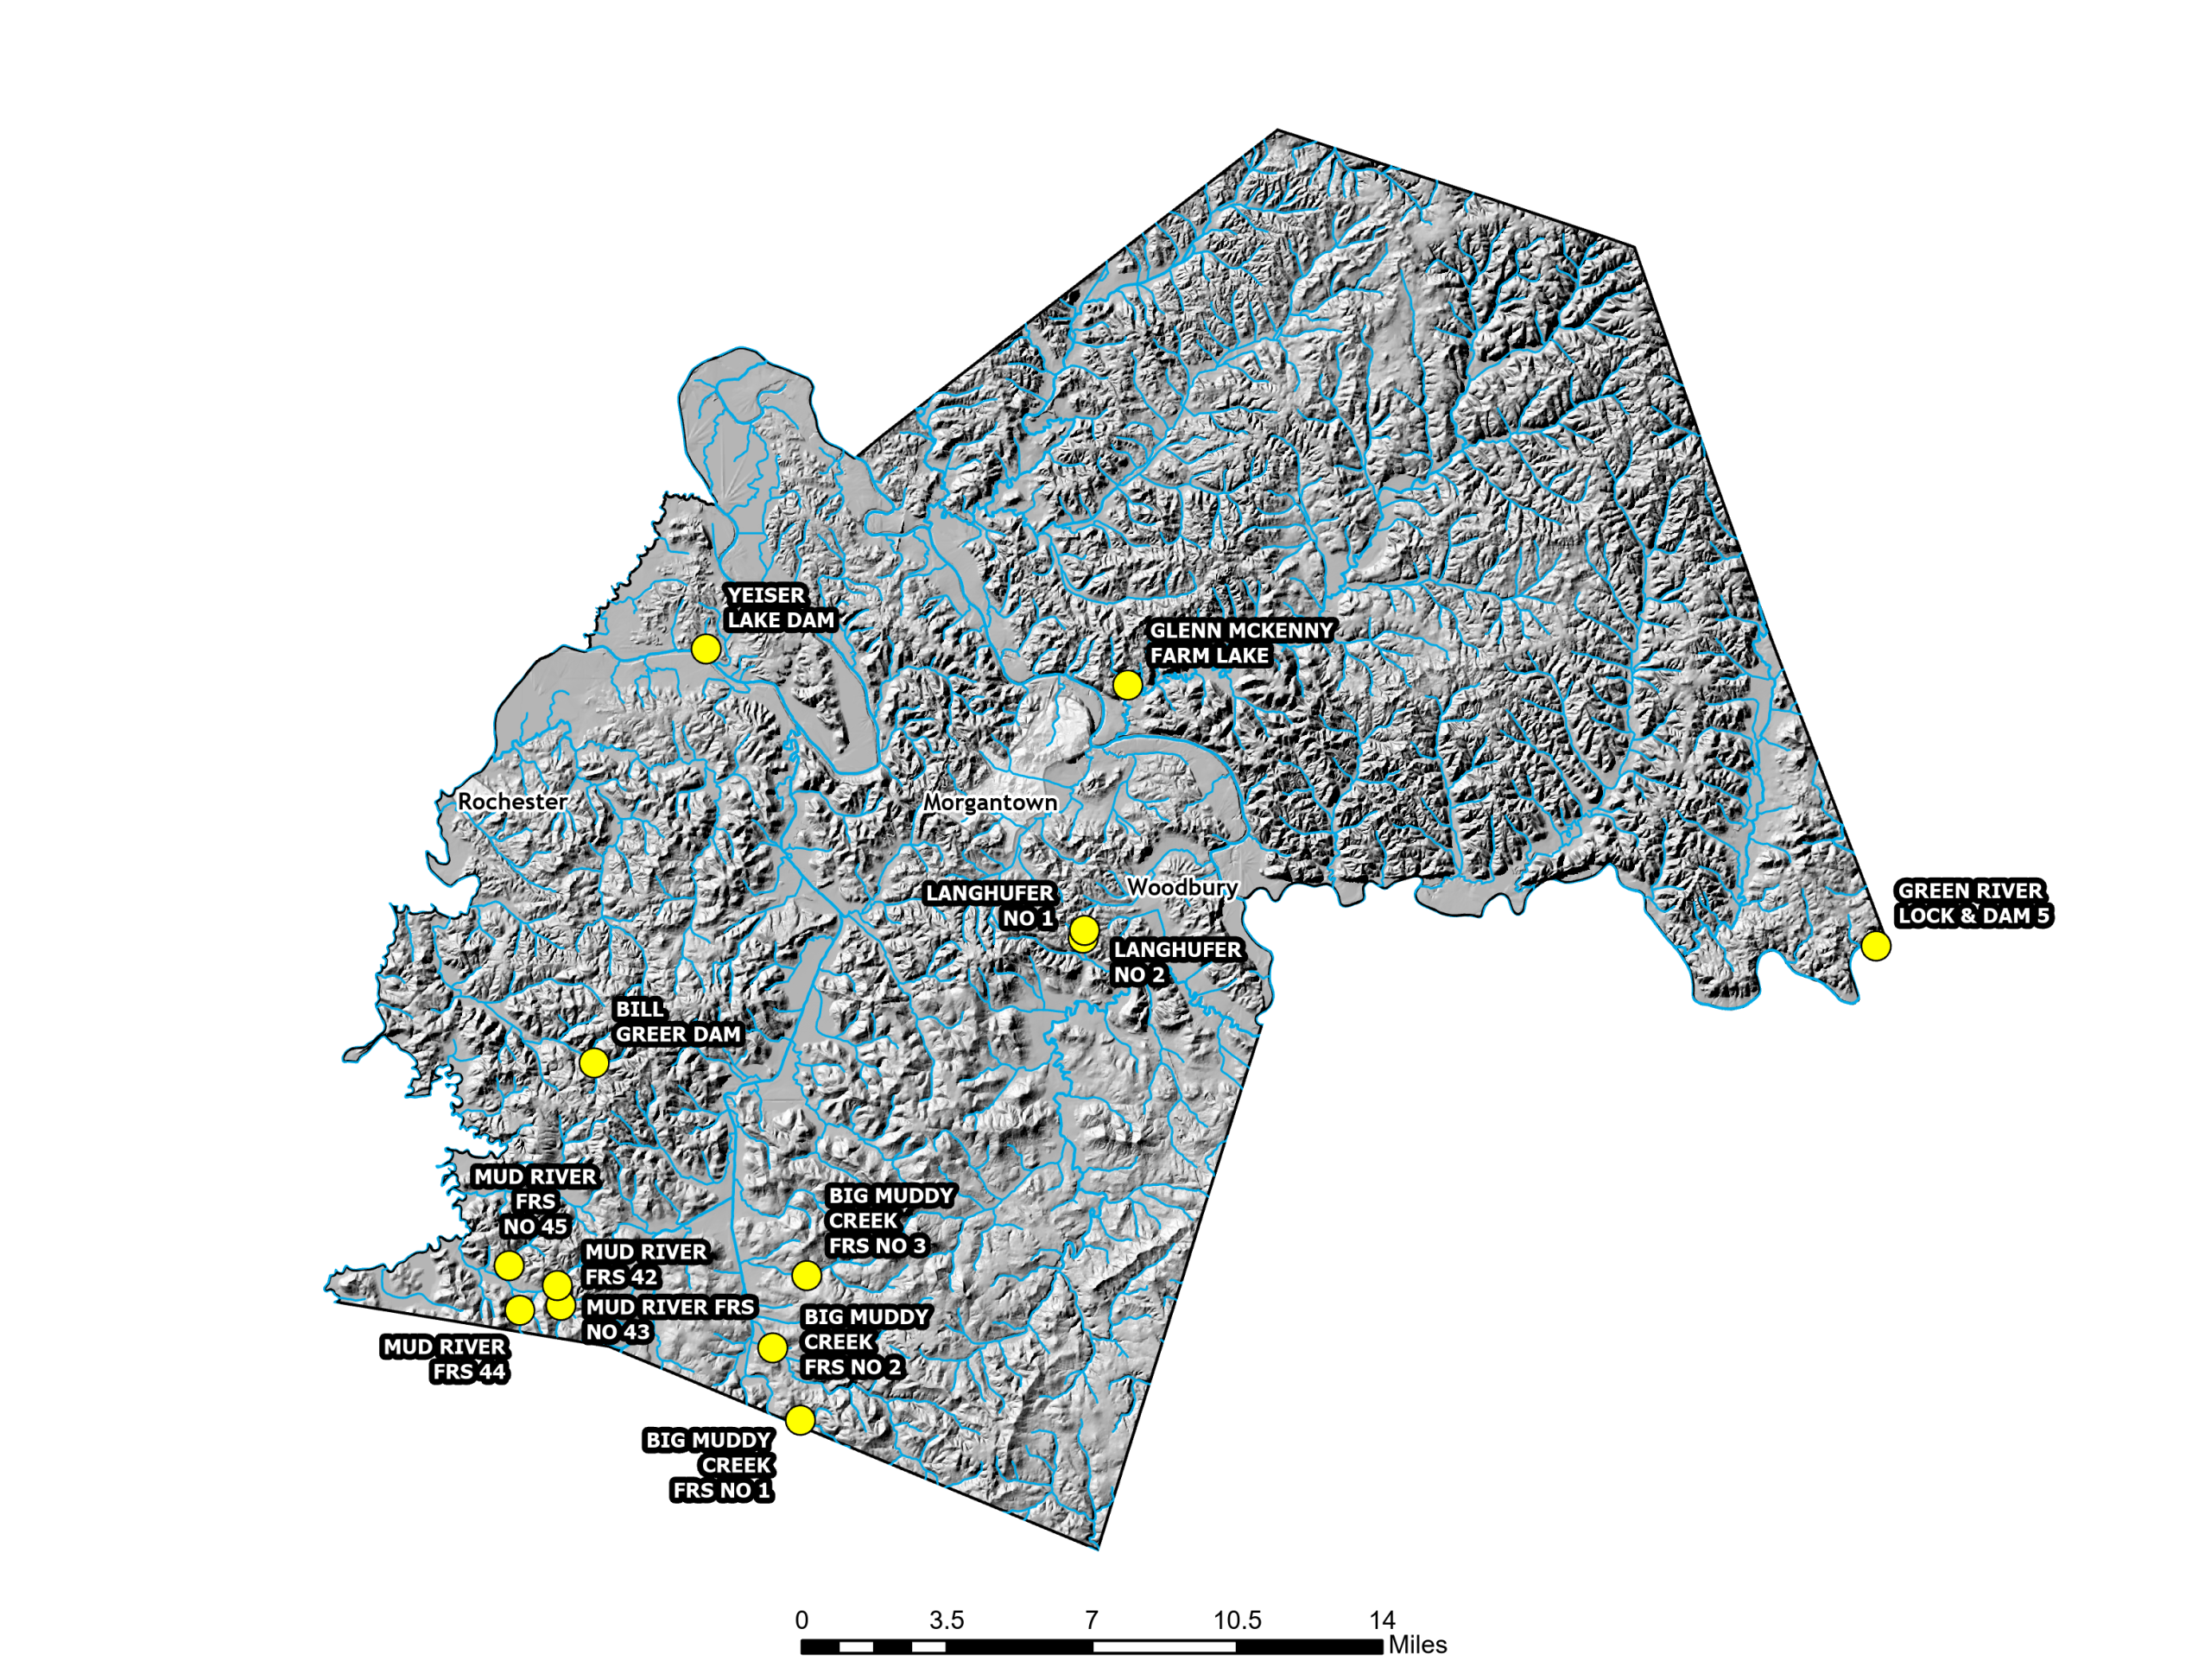
A breach at a large upstream federal reservoir could produce high-velocity, deep flooding propagating down the Green River mainstem through Butler County; consequence severity depends on reservoir level at failure, breach size, travel time, and channel capacity. Failure of low-head/navigation remnants (Rochester; L&D #4/#5) would more likely drop the upstream pool and alter hydraulics locally rather than create catastrophic downstream flooding.
History of Dam Failure
There is no record of catastrophic dam failure affecting Butler County; however, USACE has undertaken (or proposed) dam-removal/structure-removal actions on obsolete Green River navigation works to address safety, environmental, and ownership concerns (e.g., L&D #5 removal work resumed in 2024; Draft EA (May 2025) proposes removing L&D #4 remnants).
Probability
Catastrophic dam failure probability is very low due to federal ownership, design standards, inspections, instrumentation, and Emergency Action Planning; however, low-probability/high-consequence risk persists and warrants planning for warning, evacuation, and continuity. More credible scenarios include: gate/mechanical issues causing elevated releases, spillway operations during extreme inflows, or localized damages requiring emergency drawdown. State dam-safety authorities (KDEP Dam Safety) and USACE maintain oversight and emergency procedures that further reduce likelihood but not consequence.
Impact
Built Environment:
A breach can produce rapid inundation that damages or destroys buildings, blocks roads with debris, disrupts traffic and emergency services, and threatens water/wastewater systems—especially if a reservoir supplies drinking water.
Natural Environment:
Floodwaves can scour channels, mobilize debris and contaminants, and disrupt aquatic habitats and riparian systems.
Social Environment:
Fast-arriving floodwaters elevate life-safety risk, particularly for people living/working in low-lying downstream areas with limited warning or evacuation options.
Climate Impacts on Dam Failure:
Increasingly intense rainfall, longer wet periods, and more frequent extreme storm events can raise hydraulic loading on dams, heighten the risk of overtopping, accelerate erosion of embankments and spillways, and reduce warning/response time. Climate-driven shifts can also stress aging infrastructure and complicate reservoir operations (e.g., balancing flood control with drought storage), making proactive maintenance, updated hydrologic/hydraulic studies, and EAP exercises even more critical.
Butler County’s vulnerability concentrates along the Green River floodplain—including Morgantown/Woodbury/Rochester corridors, low-lying county roads and bridges, and utilities that cross or parallel the river. Populations with limited mobility or transportation, manufactured housing in low areas, and recreation users at river access points face elevated risk from short-fuse warning and swift water. Priority data needs include current dam-failure inundation boundaries, travel-time estimates, and an inventory of critical facilities intersecting modeled flooding, paired with validation of sirens/IPAWS, reverse-911 coverage, and door-to-door protocols for river-edge pockets.
Communities and infrastructure situated along river corridors are sensitive to breach waves and debris loads. Historic attention to the Rochester Dam (study of potential failure consequences) highlights the importance of
consequence assessment and cross-jurisdictional coordination for downstream warning and evacuation.
Drought in Butler County
Description
Drought is a prolonged period of below-average precipitation that reduces soil moisture, surface water, and groundwater, stressing ecosystems, agriculture, and water supply systems. In Allen County, drought can be meteorological, agricultural, hydrological, or socioeconomic, with severity influenced by both climate conditions and community demand on limited water resources.
Types of Drought
The Palmer Drought Severity Index is the most widely used measurement of drought severity. The following indicators demonstrate drought severity by comparing the level of recorded precipitation against the average precipitation for a region.
- A meteorological drought is defined by the degree of dryness and the duration of a period without precipitation.
- Agricultural drought ties attributes of meteorological drought with agricultural impacts, often focusing on the amount of precipitation and evapotranspiration, which is the transference of water from the land to the atmosphere via evaporation. The magnitude of this type of drought is often conceptualized as the difference between plant water demand and available soil water. Because of this, the definition of agricultural drought accounts for the susceptibility of crops at the various stages of their development cycle
- Hydrological drought refers to below average water content in surface and subsurface water supply. This type of drought is generally out of phase with meteorological or agricultural drought.
- Socioeconomic drought focuses more on the social context that causes and intensifies drought conditions. This type of drought links meteorological, agricultural, and hydrological drought to supply and demand.
Location/Extent
In Butler County, drought extent is typically countywide, with impacts varying by soils, crop types, and water sources. Agricultural impacts (forage stress, reduced yields) are the most common, while potable water impacts are generally less frequent but possible during prolonged deficits or high summer demand.
Sensitivity is elevated for row-crop and pasture lands, small public water systems or systems with leakage/limited storage, and surface-water/groundwater users lacking redundant sources. BRADD’s Water System Vulnerability to Drought resource further highlights system-level considerations for the region.

Past Events
Butler County has experienced recurring drought since 2000, with agricultural impacts the most common, and less frequent stress to potable water systems. USDM classifications and USDA drought disaster designations have periodically included Butler County at the contiguous-county level.
Notable events include the 2012 drought, when much of Kentucky—including Butler County—reached D3 (Extreme Drought) on the U.S. Drought Monitor, with widespread agricultural losses, elevated fire risk, and water shortages.
From 2000–2020, Butler County experienced ~54weeks of D2 (Moderate) and ~13 weeks of D3 (Severe/Extreme) drought.
Probability
Long-term monitoring indicates drought is a recurrent hazard. Butler County experienced 611 total weeks of drought over the last 21 years—about a 47% chance that any given week features drought conditions. Projections suggest drought likelihood may increase with climate change as rising temperatures and shifting precipitation patterns extend dry periods.
Impact
Built Environment:
Lower reservoir and well levels can strain municipal water systems, increase infrastructure operating costs (e.g., pumping/energy), and trigger usage restrictions for businesses and institutions; prolonged deficits can reduce fire-flow availability for rural systems.
Natural Environment:
Drought reduces streamflow and aquatic habitat quality, stresses forests and grasslands, and can degrade water quality as lower volumes concentrate pollutants.
Social Environment:
The largest local effects are economic losses in agriculture (crop failures, livestock stress, higher irrigation costs) and secondary risks such as increased wildfire potential; households and small businesses can face water shortages and higher costs.
Climate Impacts on Dam Failure:
Rising temperatures increase evapotranspiration and soil‐moisture loss, while shifting precipitation patterns can produce longer dry spells punctuated by intense storms that do little to recharge groundwater. Hotter summers elevate water demand, stress crops and livestock, worsen algal blooms and other water-quality issues in low flows, and compound risks when heat waves coincide with drought—intensifying health, agricultural, and infrastructure impacts across Barren County.
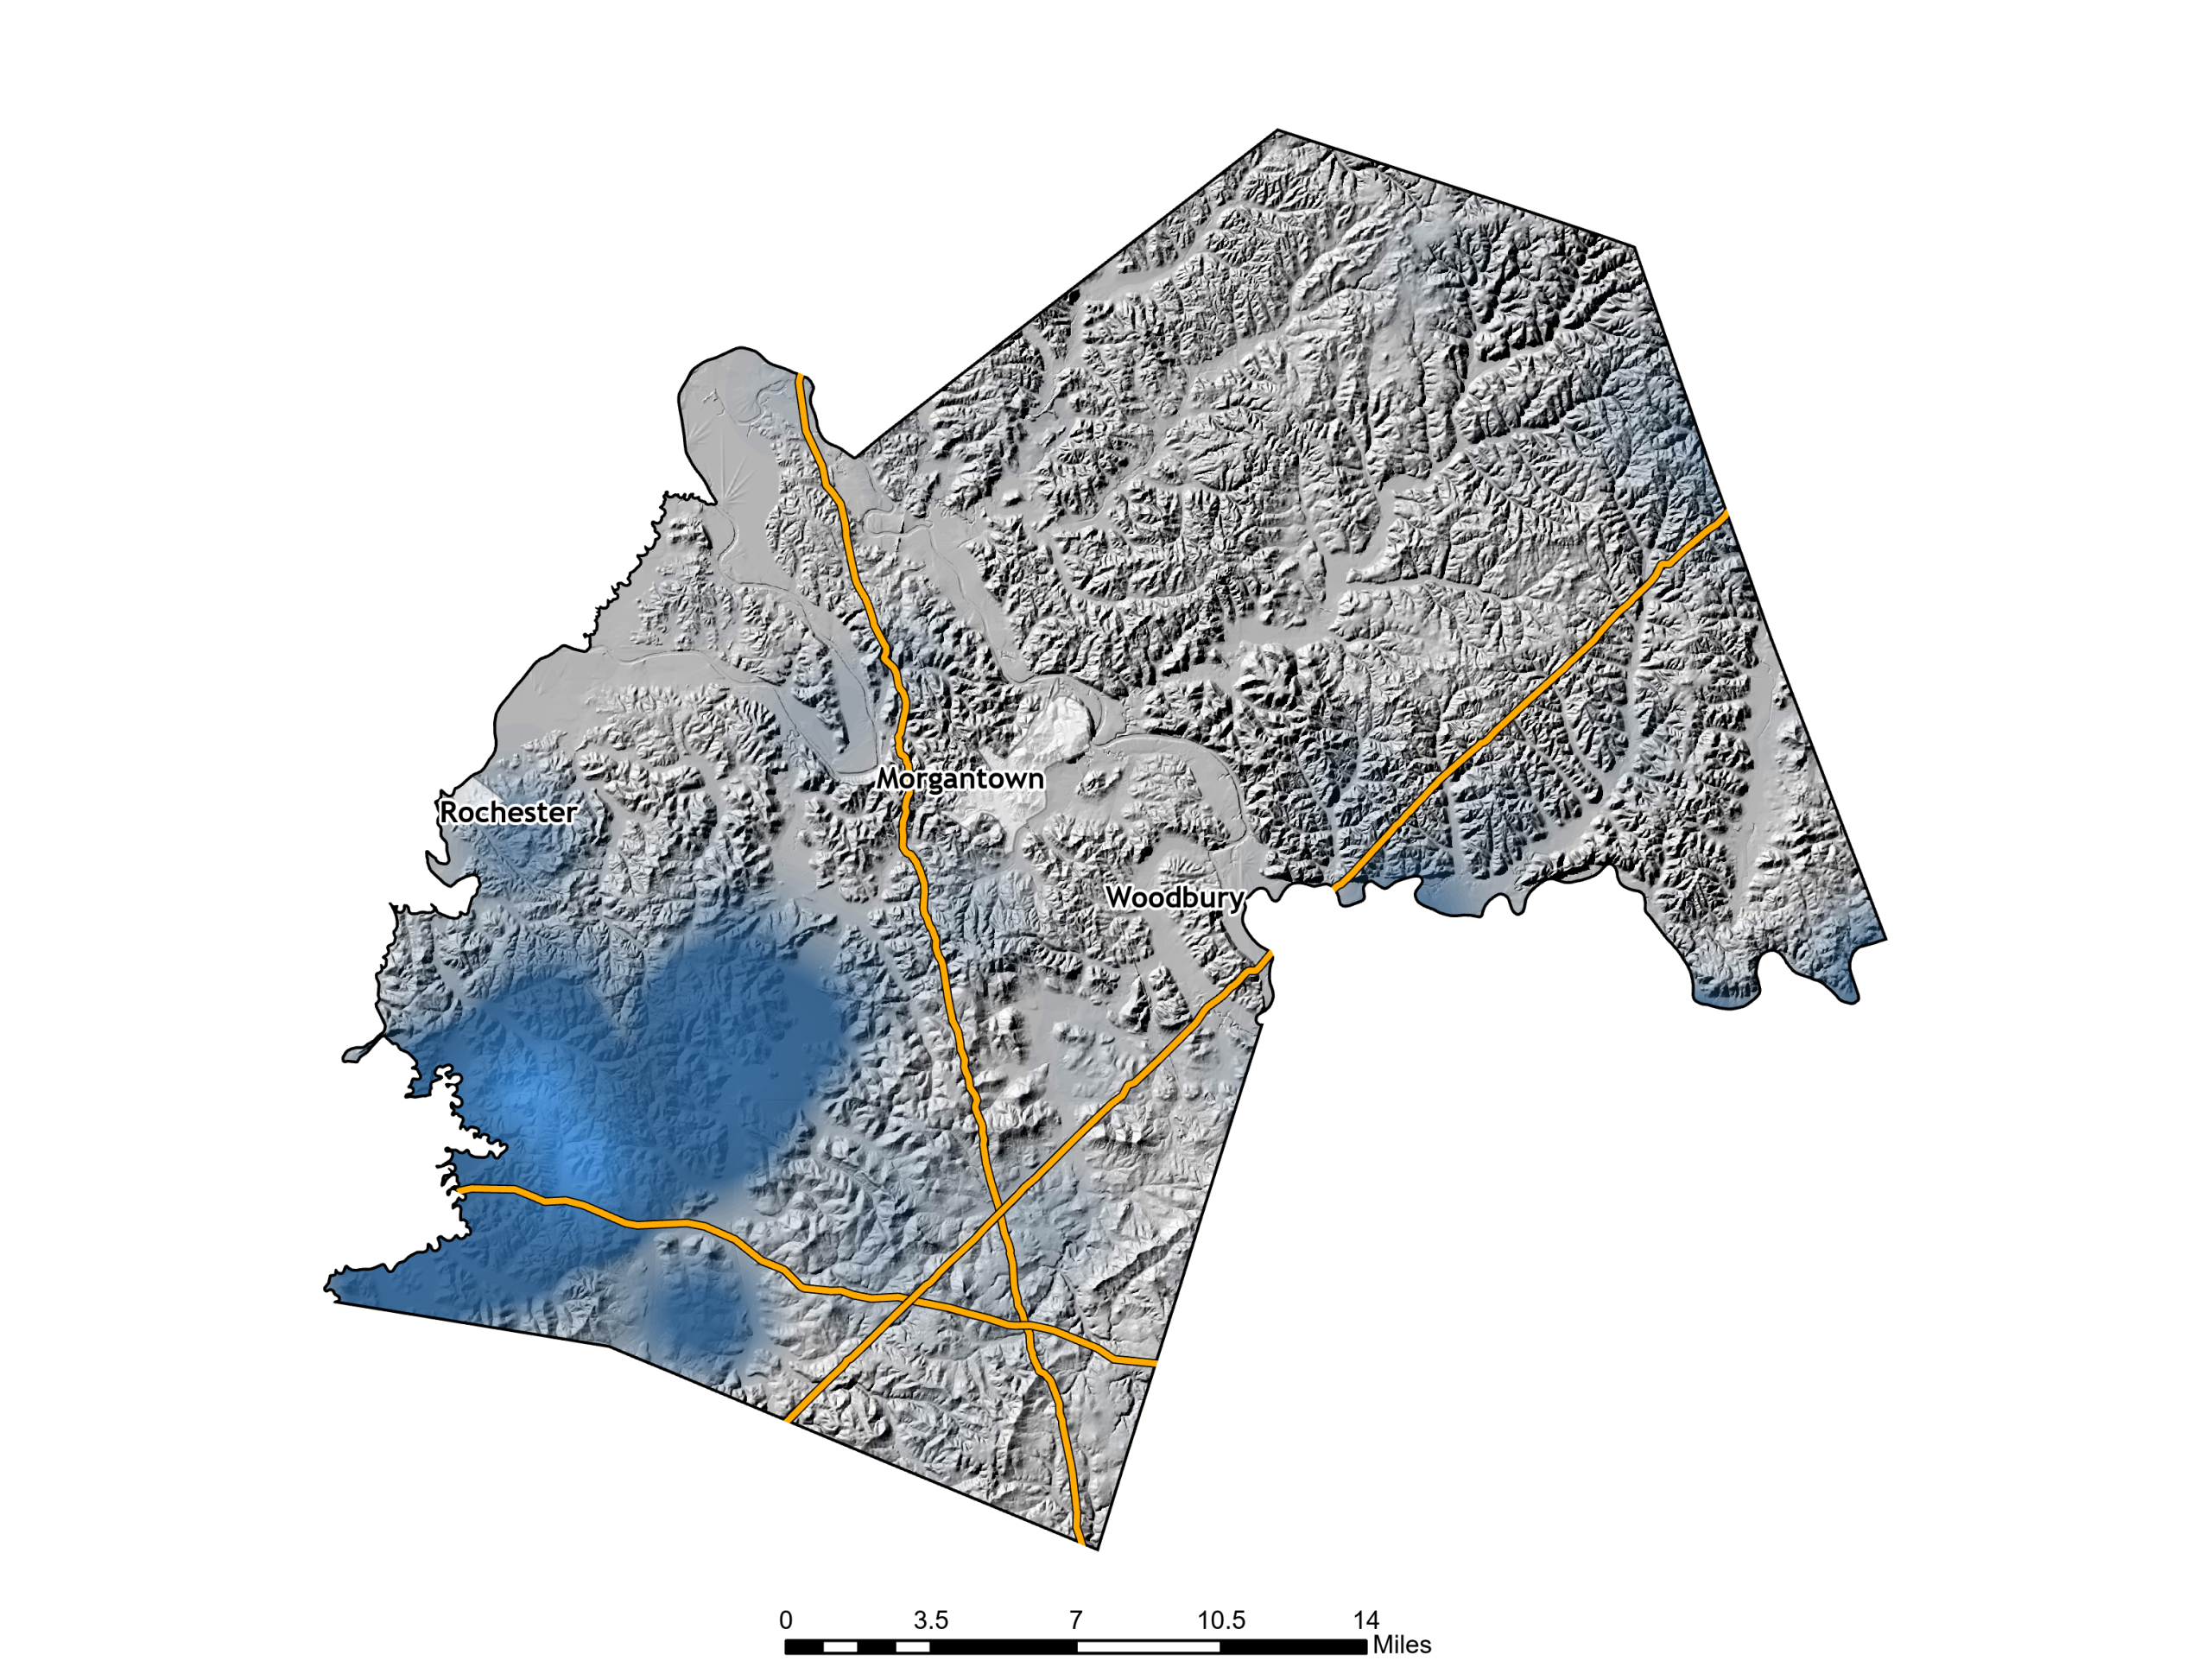
Drought Vulnerability in the BRADD Region
Soil Susceptibility
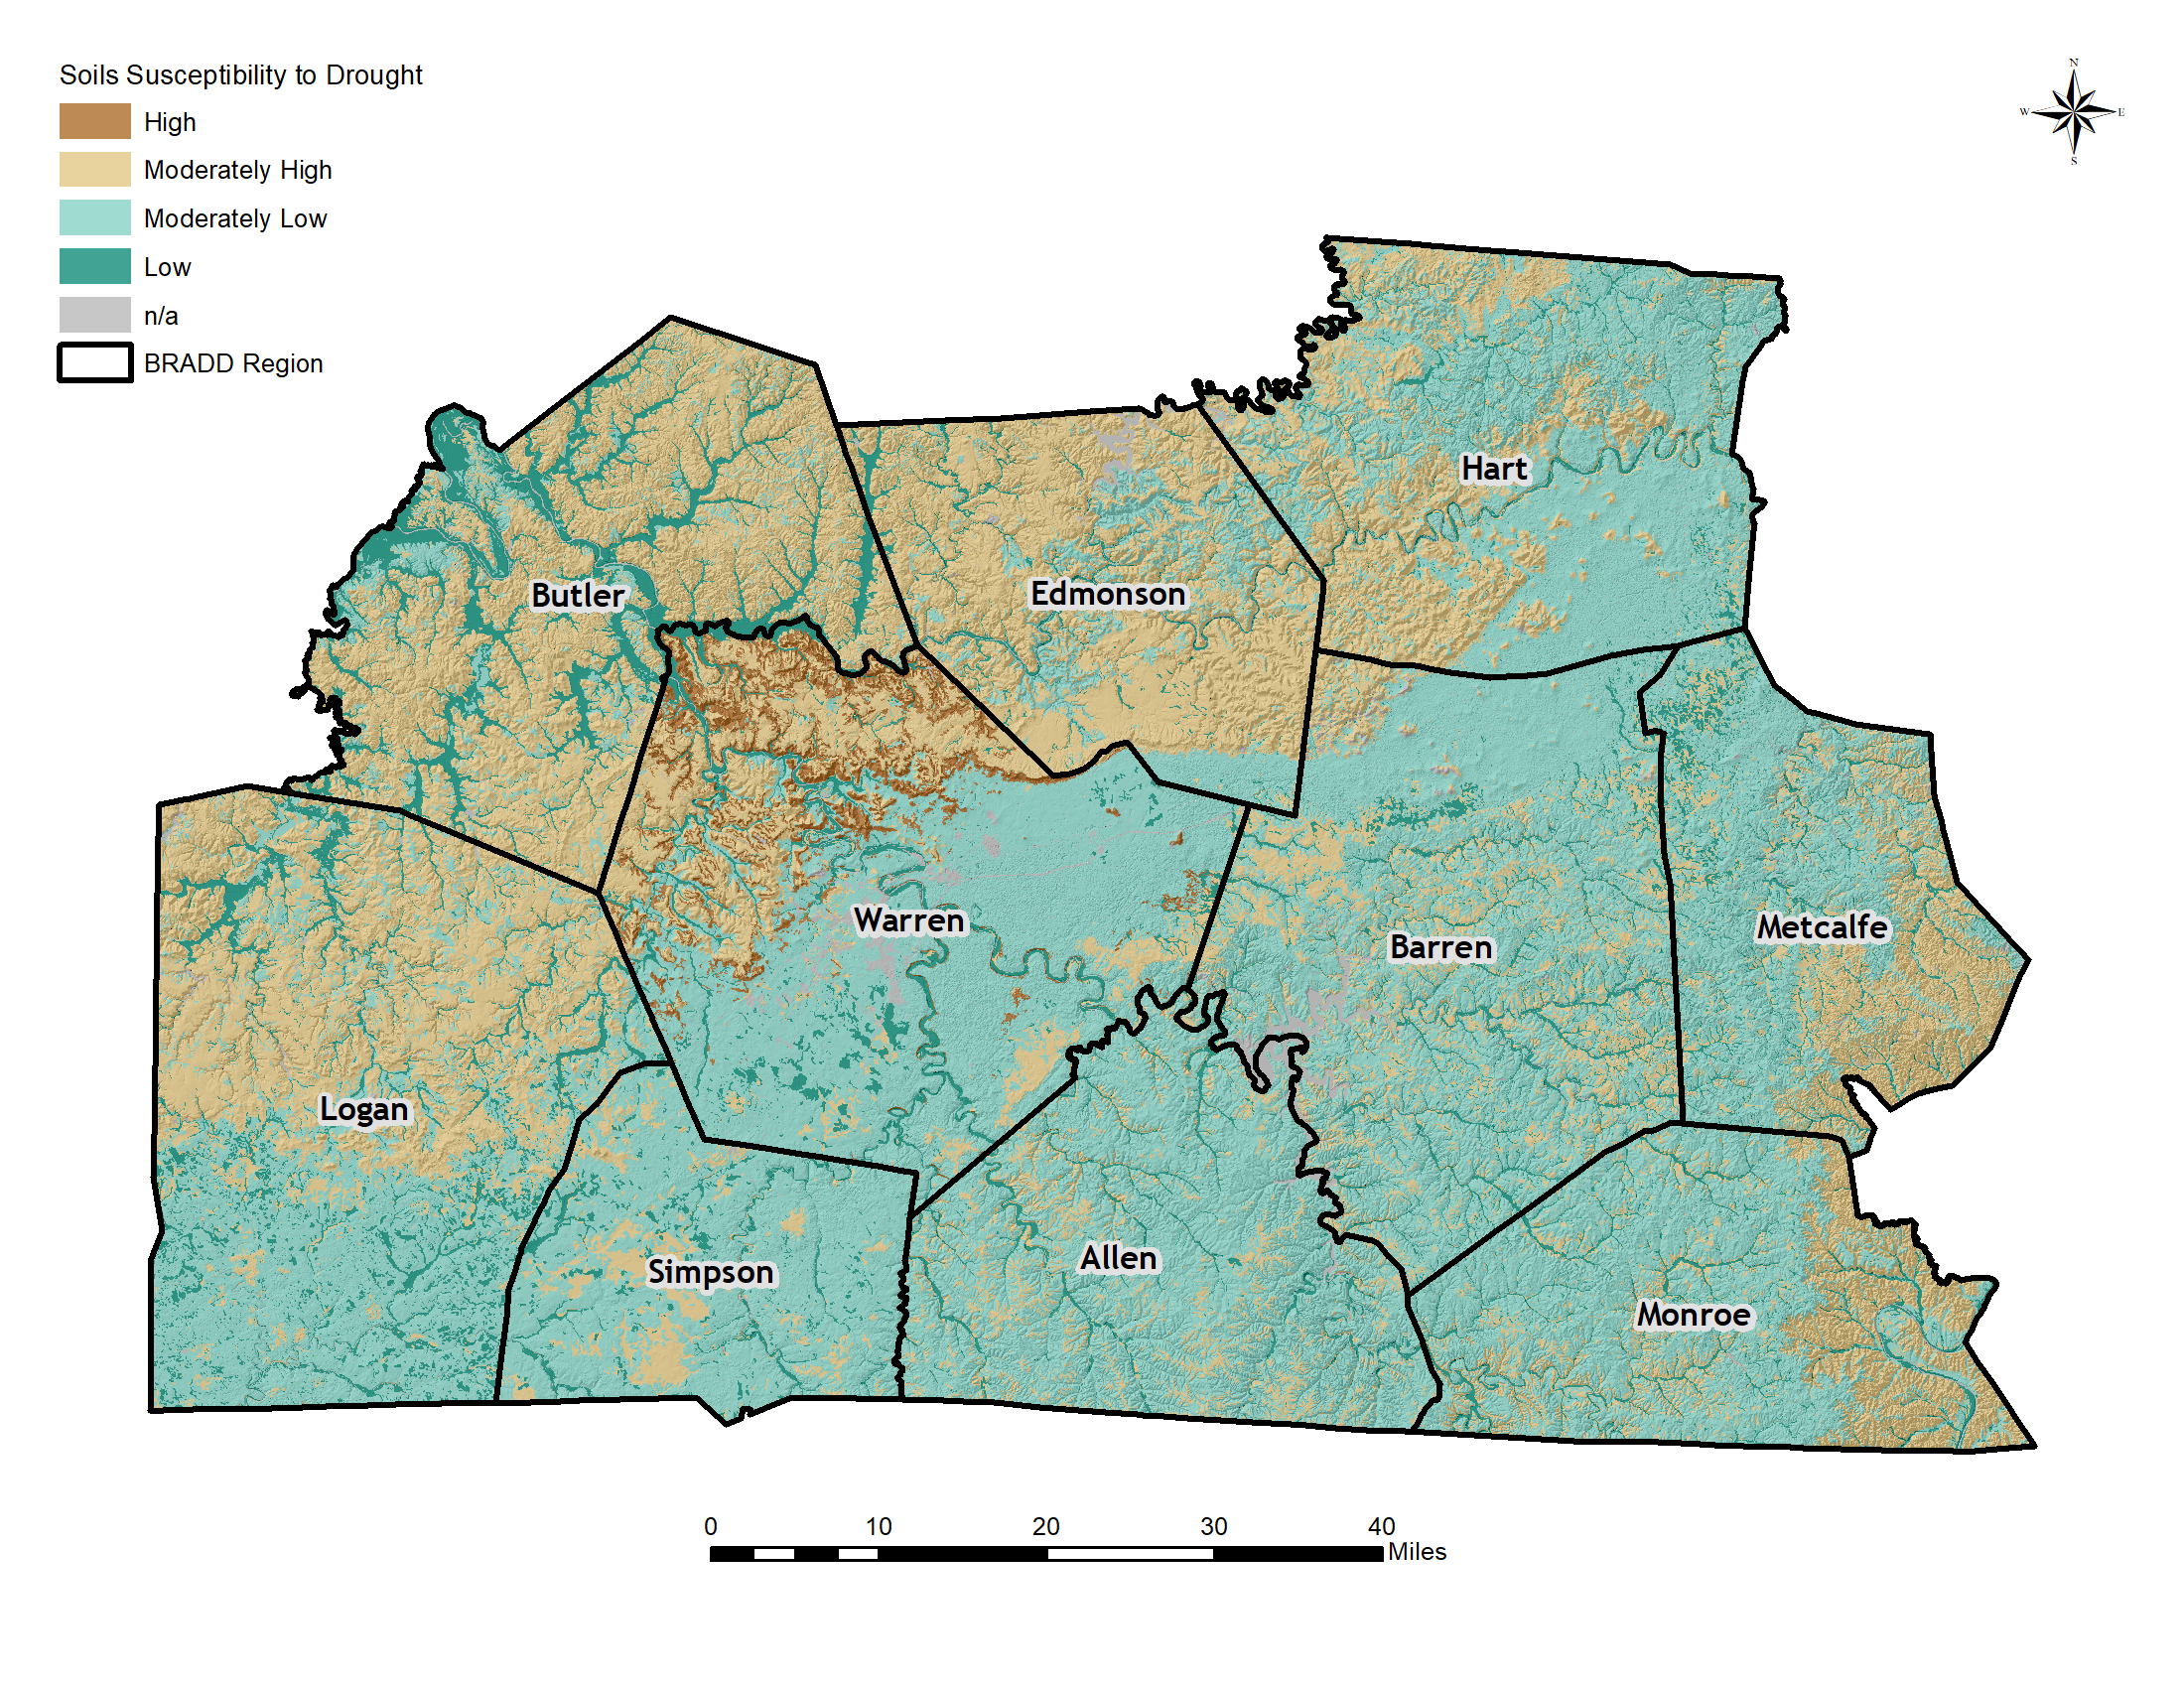
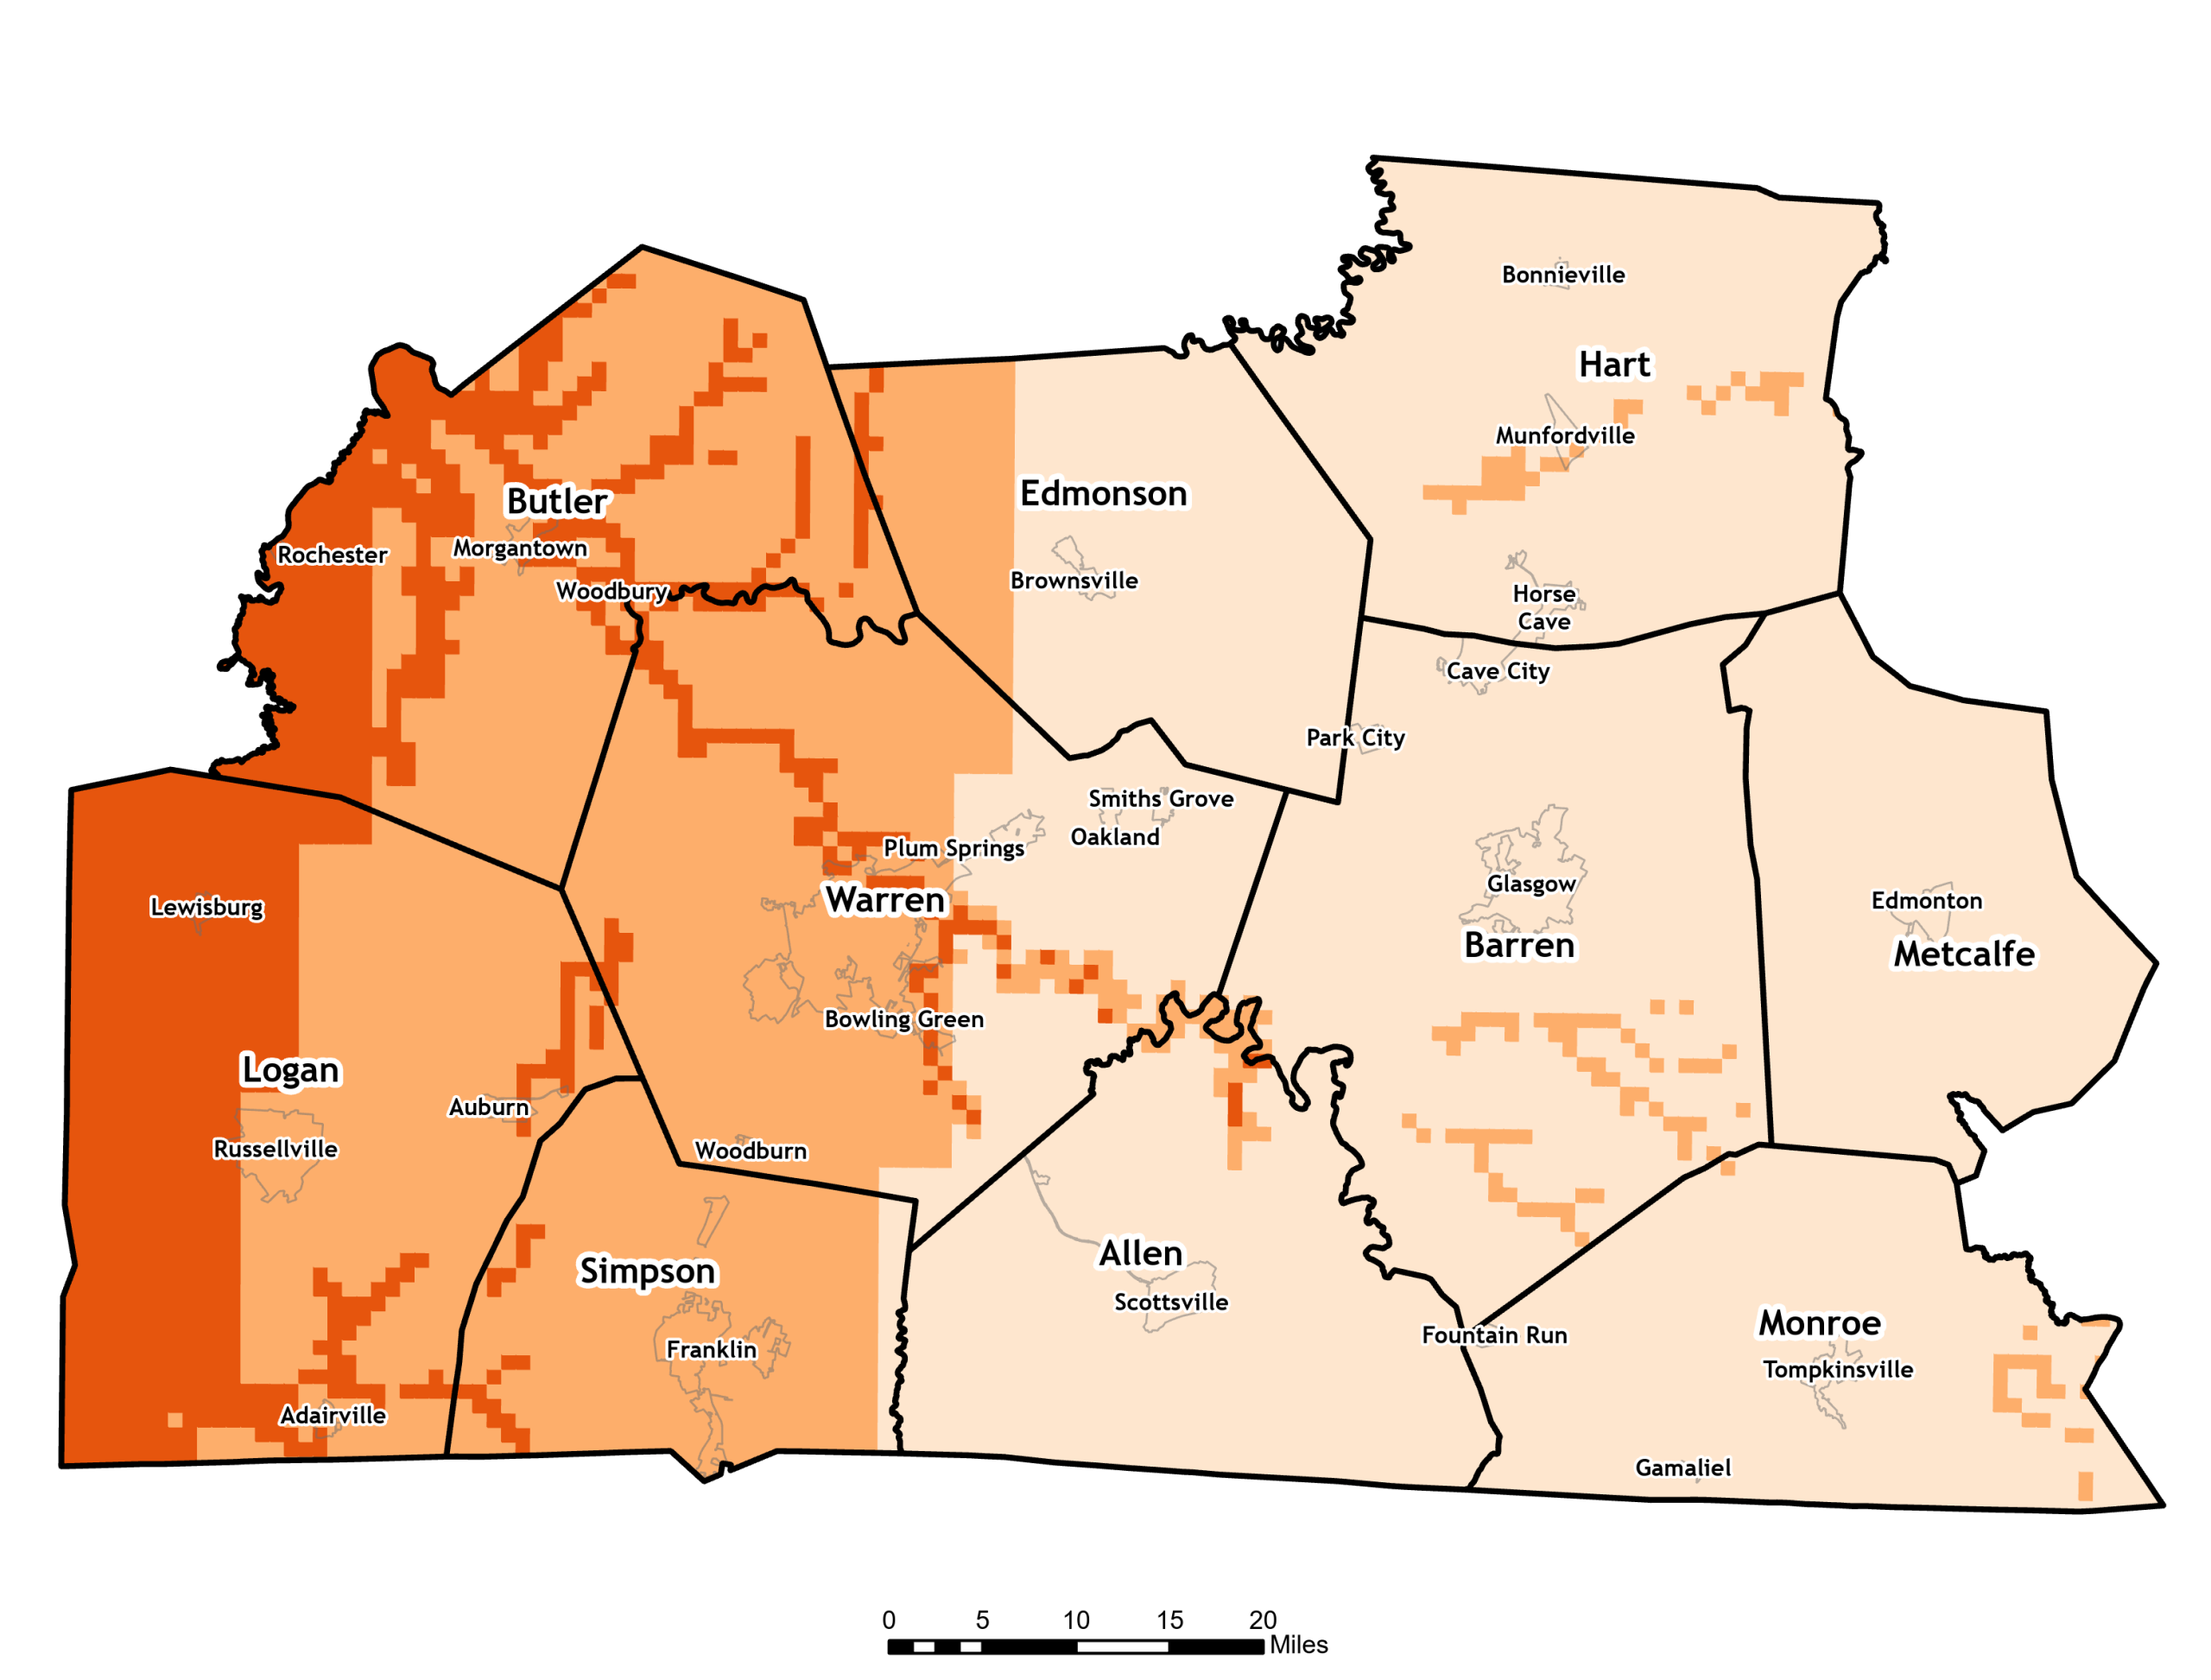
Soil’s susceptibility to drought varies due to a myriad of factors. The map below depicts vulnerability to drought based on soil type from a moisture retention and availability perspective. For example a shallow fragipan limits the depth of the soil making it more vulnerable to moisture loss. Grey areas indicate that no soil data was available due to lakes, heavily urbanized areas, or strip mining. Susceptibility to Drought Scores were established using the criteria of infiltration, water movement, and water supply for the soils defined in the NRCS Soil Surveys that encompass the state.
Butler County’s vulnerability concentrates in agriculture (row crops, pasture, livestock), small/single-source water systems with limited storage or higher distribution losses, and households with lower adaptive capacity (e.g., limited resources for cooling, well maintenance, or alternative supplies). Private wells/springs in rural areas may see shortages sooner than municipal customers. Communities with more older adults and outdoor workers face compounding risk when heat coincides with drought. Continued investment in leakage reduction, source redundancy/interconnections, storage, demand-side conservation, and drought-contingency triggers reduces exposure for both municipal and rural users.
Butler County’s public water system demonstrates low vulnerability to drought.
The soil susceptibility map indicates that large swaths of Butler County’s soil experience moderately high susceptibility to drought.
Overall, Butler County has a moderately high vulnerability to drought. Because drought is a non-spatial hazard, this same analysis can be applied to its respective cities – Rochester, Morgantown, and Woodbury.
Earthquakes in Butler County
Description
An earthquake is a sudden release of energy in the Earth’s crust that produces ground shaking capable of damaging buildings, lifelines, and critical services. In south-central Kentucky, risk is influenced by regional seismic zones (notably New Madrid and Wabash Valley) and by local site conditions that can amplify shaking—especially softer soils over bedrock and saturated valley deposits. Building code provisions and seismic design values are informed by the USGS National Seismic Hazard Model.
Location/Extent

Kentucky is affected by nearby seismic zones—New Madrid (most active east of the Rockies) and Wabash Valley (capable of M5.5–6.0 damage near population centers). Potential shaking in Butler County ranges from weak/noticeable (MMI II–IV) during distant events to light–moderate (MMI V–VI) in rarer, larger scenarios; secondary effects can include nonstructural damage, minor slope instability, and utility disruptions. The eastern U.S. crust transmits shaking efficiently, so distant earthquakes can be widely felt.
Severity is commonly expressed by earthquake magnitude and by shaking intensity (Modified Mercalli Scale). Butler County’s worst-case consequences depend on regional event size/distance and local amplification/liquefaction potential.
| Intensity | Verbal Description | Witness Observation | Maximum Acceleration (cm/sec2) | Corresponding Richter Scale |
| I | Instrumental | Detectable on Seismographs | <1 | <3.5 |
| II | Feeble | Felt by Some People | <2.5 | 3.5 |
| III | Slight | Felt by Some People Resting | <5 | 4.2 |
| IV | Moderate | Felt by People Walking | <10 | 4.5 |
| V | Slightly Strong | Sleepers Awake; Church Bells Ringing | <25 | <4.8 |
| VI | Strong | Trees Sway; Suspended Objects Swing; Objects Fall off Shelves | <50 | 4.8 |
| VII | Very Strong | Mild Alarm; Walls Crack; Plaster Falls | <100 | 6.1 |
| VIII | Destructive | Moving Cars Uncontrollable; Masonry Fractures; Poorly Constructed Buildings Damaged | <250 | |
| IX | Runious | Some Houses Collapse; Ground Cracks; Pipes Break Open | <500 | 6.9 |
| X | Disastrous | Ground Cracks Profusely; Many Buildings Destroyed; Liquefaction and Landslides Widespread | <750 | 7.3 |
| XI | Very Disastrous | Most Buildings and Bridges Collapse; Roads, Railways, Pipes, and Cables Destroyed; General Triggering of Other Hazards | <980 | 8.1 |
Past Events
BRADD records indicate few locally recorded events in the district and none historically ≥M3 in Butler County, though nearby counties have experienced small events. Regionally, occasional felt earthquakes occur in the ETSZ and WVSZ; the well-known 1811–1812 NMSZ sequence produced very strong shaking across Kentucky. Recent felt events in the central U.S. demonstrate that even moderate quakes can be widely felt due to eastern U.S. geology.

Probability
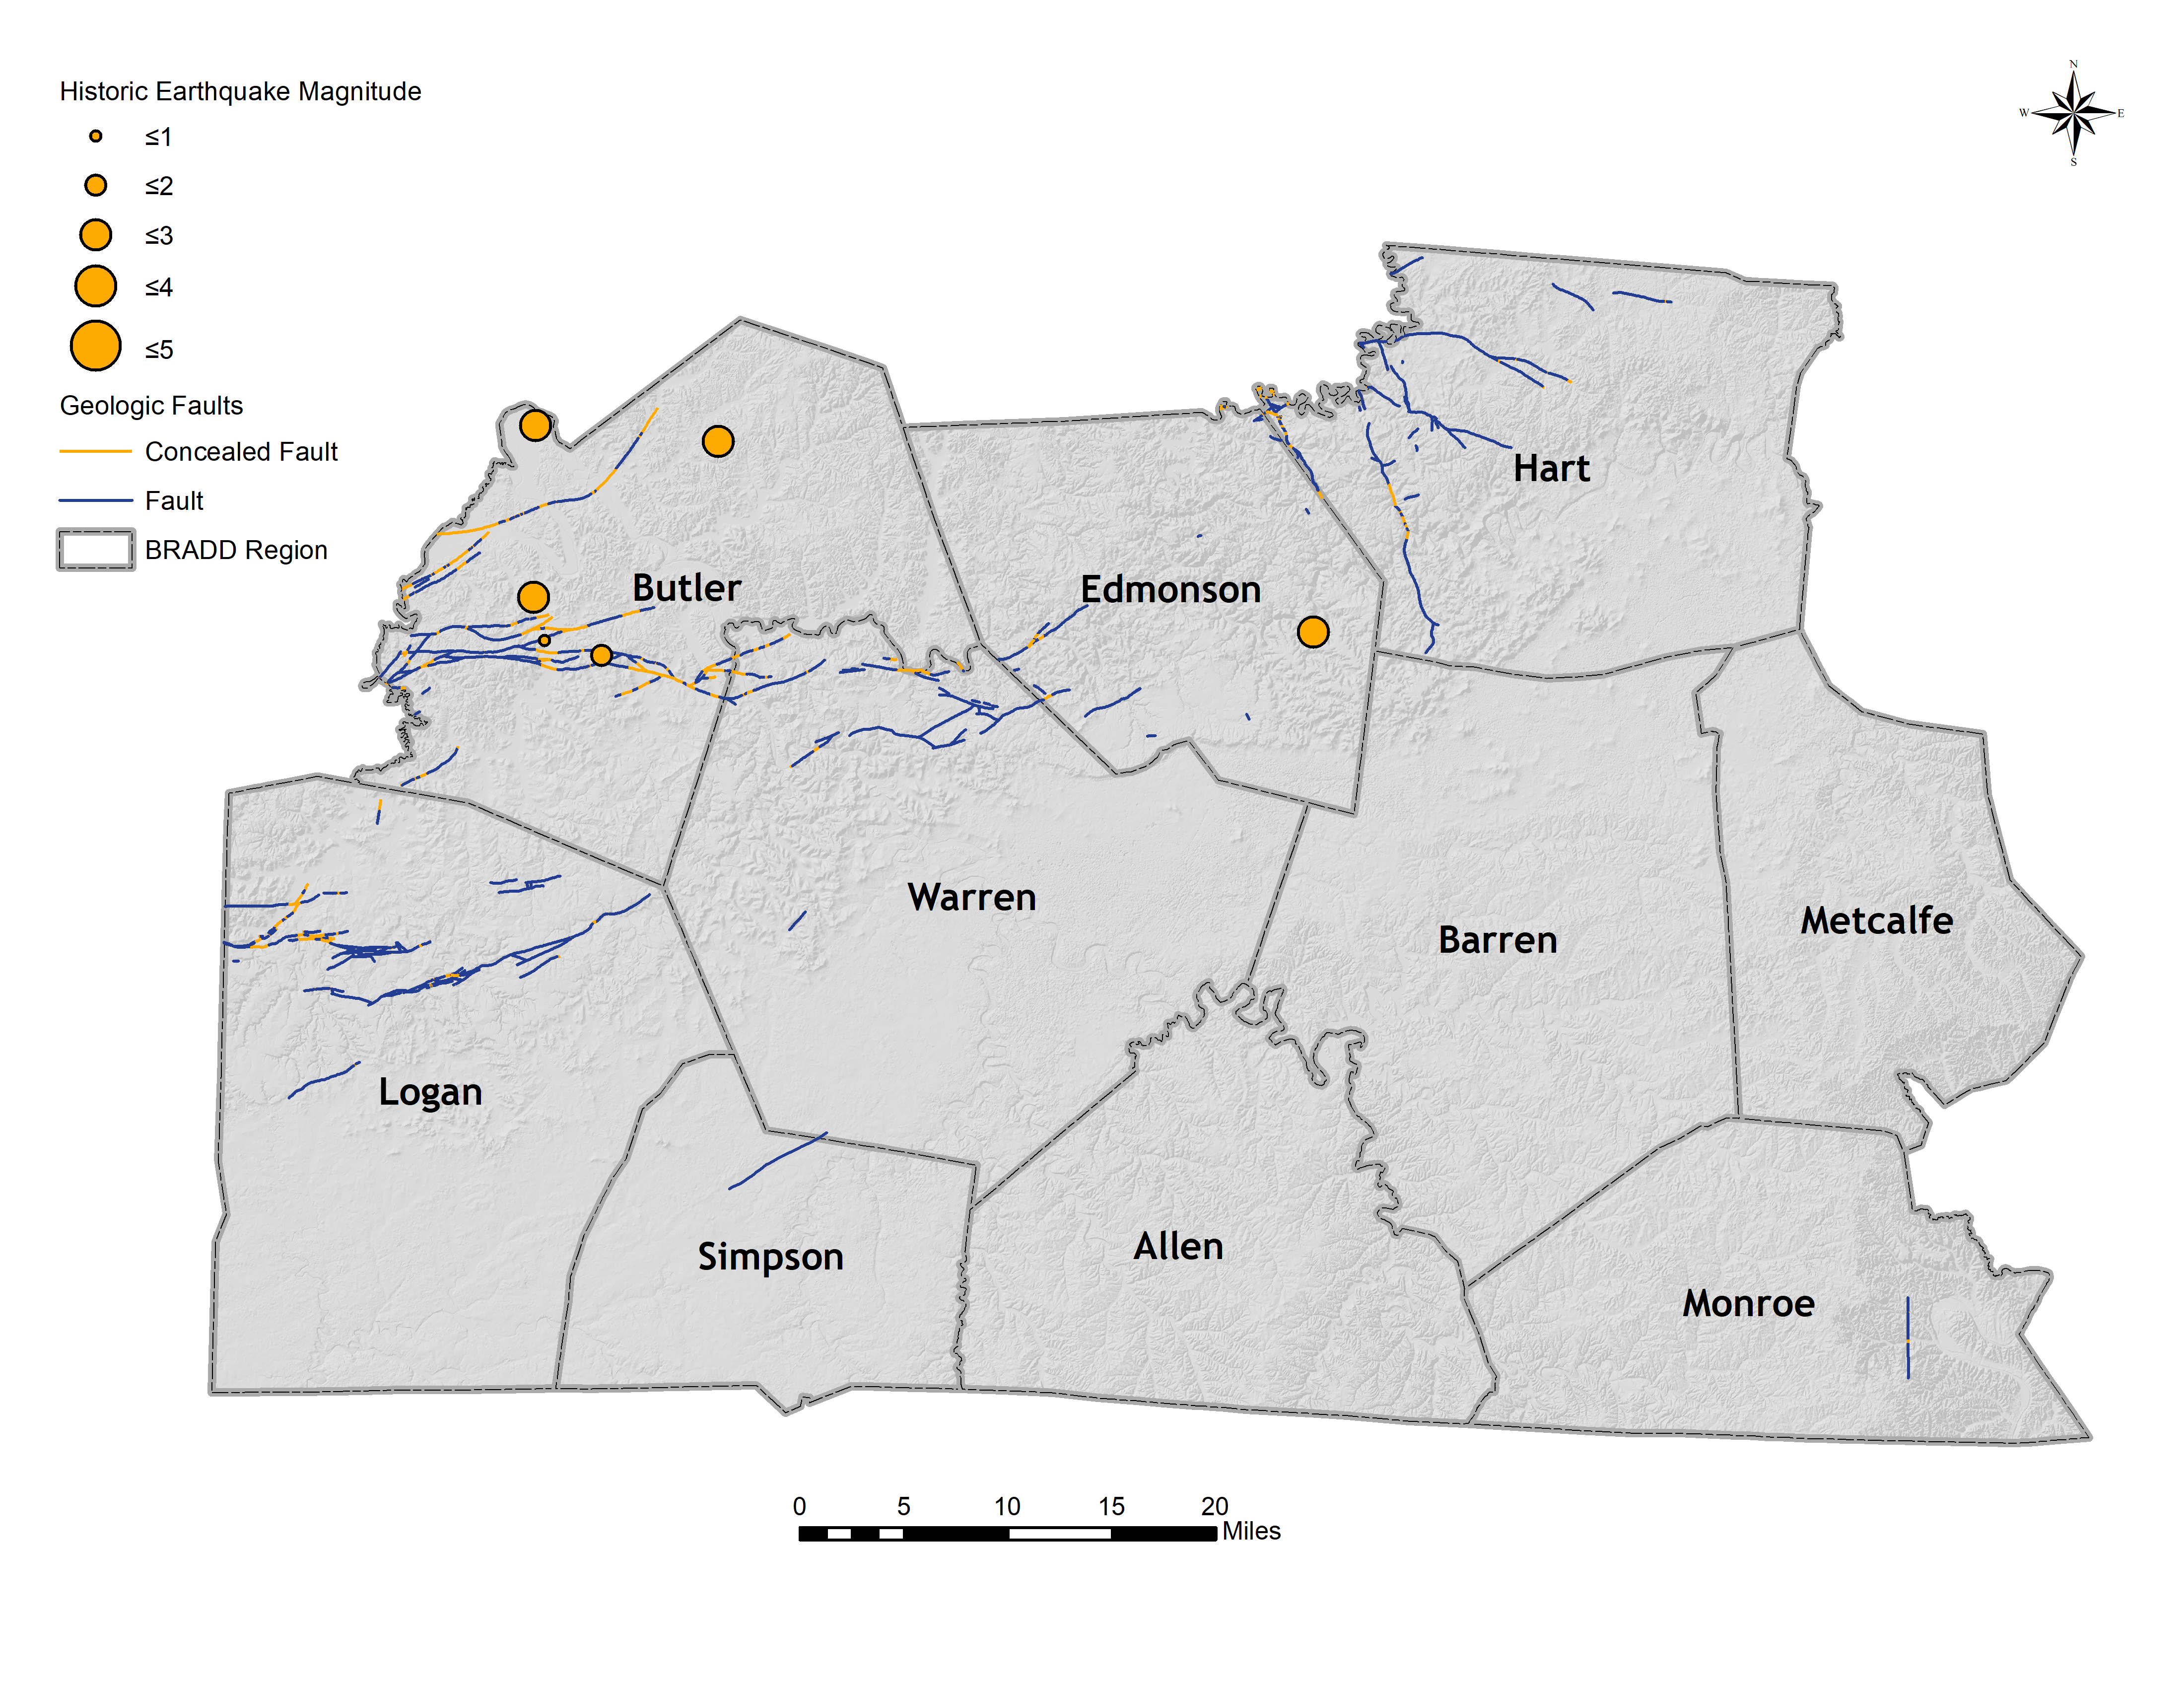
Scientists estimate that there is a 25-40% probability of a 6.0 or higher magnitude earthquake within any 50-year period. Butler County has experienced 5 earthquakes, 3 of which were ranked at a magnitude of 3. Though Western Kentucky has not experienced any recent earthquakes that have caused major structural damage, the potential for such an event warrants local government, residents, and businesses within the BRADD region to take precaution and implement plans, procedures, and projects to mitigate the impact of a strong earthquake. It’s really not a question of if but when. Earthquakes can occur at any time of year and warning time is essentially nonexistent. Barren County lies within the higher risk area mapped major faults and would feel regional events; site soils can amplify shaking.
Impact
An earthquake could result in structural damage to older buildings, critical facilities, and infrastructure not designed to modern seismic codes. Bridges, utilities, and water systems could sustain significant damage, leading to service disruptions. Secondary impacts might include landslides in certain areas, hazardous material spills, and challenges in emergency response due to blocked roads and damaged communication systems. Economic losses could be substantial, particularly for uninsured property owners.
Built Environment:
Shaking can damage homes and business structures, collapse unreinforced elements, and disrupt roads/bridges, power, water/wastewater, and telecom. Post-event debris and utility outages can hinder emergency response.
Natural Environment:
Secondary effects—liquefaction, landslides, fires, and hazmat releases—can degrade soils, waterways, and habitats.
Social Environment:
Transportation disruption, hospital surge, power/water interruptions, and communications overload elevate life-safety risk and complicate reunification and care for vulnerable groups (children, older adults, LEP populations).
Climate Impacts on Earthquakes:
While climate change does not drive tectonic earthquakes, hydrologic extremes (prolonged drought, heavy precipitation, groundwater withdrawal/recharge) may alter subsurface stresses in limited contexts. The BRADD region has an overall low earthquake risk, so any climate influence on local frequency/severity is likely minor relative to tectonic controls.
Earthquake Vulnerability in Allen County
Butler County is mapped in a “high perceived shaking” zone for high-magnitude regional scenarios and contains significant local fault lines. Because earthquakes are non-spatial at the county scale, this vulnerability characterization applies countywide (including Morgantown, Rochester, and Woodbury). Key sensitivity factors remain older/unnretrofitted buildings, critical facilities, bridges, and lifelines on softer soils or in potential liquefaction areas.
Overall structural vulnerability is low for typical Butler County construction, but consequence hotspots exist where older or unreinforced masonry, critical facilities, and dense nonstructural systems (labs, server rooms, suspended ceilings) coincide with amplifying soil conditions in valley/fill areas. Lifelines—I-165/US-231 bridges and approaches, water/wastewater plants and lift stations, and electric distribution—are vulnerable to operational interruptions that can outsize the actual shaking level. Residents with limited mobility/transportation or reliance on powered medical devices are more sensitive to short-term outages. Kentucky Geological Survey notes that while local mapped faults in the region are not considered active, earthquake damage remains possible in Butler County. Priorities include nonstructural bracing/anchorage, targeted retrofit screening of critical/legacy buildings, backup power and water continuity, and bridge/utility vulnerability checks to guide cost-effective upgrades.
Butler County is within the “light” to “moderate” perceived shaking zone for a high magnitude earthquake and does contain significant local fault lines.
Because of these factors, Butler County experiences moderate vulnerability to earthquakes. Because earthquakes are non-spatial hazards, it can be assumed that this analysis should be applied to Butler County’s respective cities – Rochester, Morgantown, and Woodbury.
Extreme Temperatures in Butler County
Description
“Extreme temperature” includes both extreme heat (multi-day heat waves driven by high temperature and humidity) and extreme cold (cold waves with dangerous wind chills). The National Weather Service (NWS Louisville/LMK) issues Heat Advisories when Heat Index values are around 105°F for ≥2 hours and Excessive Heat Warnings at ≥110°F (or prolonged 105–110°F). LMK’s cold guidance treats apparent temperatures ≤ −10°F in south-central Kentucky as Extreme Cold thresholds for watch/warning products. These index-based triggers better capture human health risk than air temperature alone.
Location/Extent
Location and Extent
Heat and cold exposures are countywide; heat impacts are often greatest in small urbanized pockets (Morgantown, Rochester, Woodbury) where warm nights limit recovery, while cold risk peaks in exposed rural areas and along open river valleys.
Historical Occurrences
Cold. Within the regional record (2010–2021), Butler County had one wind chill watch (2014) and one wind chill warning (2015); these events were issued region-wide.
Heat. Across 2010–2021, the BRADD region recorded 18 excessive heat watches and 71 excessive heat warnings; county-level breakdowns show Barren County averaged ~41.7 extreme-heat days per year (2010–2016).
Probability
Expect recurrent heat seasons with periodic advisory/warning episodes and less frequent but hazardous cold outbreaks. While year-to-year frequency varies, local planning should assume annual heat advisories are likely, with occasional excessive-heat warnings, and intermittent extreme-cold events in some winters.
Impact
Extreme heat can lead to heat exhaustion and heatstroke, particularly in outdoor workers, the elderly, and low-income households without access to cooling. It also increases energy demand, raising utility costs and the likelihood of power outages. Severe cold poses risks of frostbite, hypothermia, and infrastructure damage, including frozen pipes and malfunctioning heating systems. Both extremes can disrupt agricultural yields, livestock health, and local economies.
Built Environment:
Cold can burst buried water pipes, strain metal bridge members, and affect trucking/rail operations (e.g., diesel gelling). Heat can soften asphalt, stress vehicle cooling systems and rail operations, and increase water demand, sometimes reducing fire-flow availability.
Natural Environment:
Cold snaps threaten livestock and wildlife and can freeze ponds/streams. Heat can degrade water quality, drive algal blooms, and reduce crop yields and dairy productivity.
Social Environment:
Cold elevates exposure risks for people without adequate shelter or heat and can increase CO poisoning and fire risk; both cold and heat create economic losses (e.g., utility repair, agriculture) and can trigger business/school closures. Heat is the leading U.S. weather-related killer, with illnesses from fatigue to heat stroke.
Climate Impacts on Extreme Temperatures:
Climate change models predict and increase in overall temperature globally for the coming decades, including the BRADD region. With a potential rise of several degrees Fahrenheit, multiple services, systems, and activities face disruption and impact. Temperature increases this small may not seem threatening, but the cumulative impacts will affect weather events, human health, and ecosystem functions, along with economic and social issues related to energy use and cost of living.
Working with
AT&T’s Climate Resilient Communities Program and the
Climate Risk and Resilience (ClimRR) Portal, BRADD identified additional opportunities for hazard mitigation action items associated with climate impacts for Extreme Temperatures in the Barren River Region. To view an interactive report of these findings,
click here.
Butler County’s vulnerability concentrates in small urban areas and among heat-sensitive populations (older adults; low-income households without efficient cooling; outdoor workers; people with chronic conditions), as well as rural residents relying on private wells or space heating that may be unreliable during outages. Schools, long-term-care, dialysis clinics, and other congregate/medical facilities face operational risks during prolonged heat—especially with warm nights—while winter ice-related power loss can rapidly escalate cold exposure for residents with limited mobility or backup heat. Priorities include index-based action triggers, cooling/warming access and transportation, backup power at critical facilities, water-system resilience (pressure/storage/leak control), and targeted outreach during alerts.
For Butler County, extreme heat presents the higher routine health burden, while extreme cold creates short-fuse, high-consequence conditions when paired with power interruptions.
On average, Butler County experienced 41.7 extreme heat days per year between 2010 and 2016. Since 2010, Butler County has experienced one wind chill watch (2014) and one wind chill warning (2015).
Because of these factors, Butler County experiences moderate to high vulnerability to extreme temperature events. Morgantown, Rochester, and Woodbury reflect Butler County’s overall history of extreme temperature, and therefore experience high vulnerability as well.
Flooding in Butler County
Description
Flooding is the overflow of water onto land that is normally dry, driven in south-central Kentucky by prolonged or intense rainfall, saturated soils, snowmelt, or infrastructure/ground-failure conditions. In addition to river (out-of-bank) flooding, the county can experience flash flooding in small basins and urbanized areas, urban/poor-drainage flooding from impervious cover, and ground-failure/karst-related flooding where subsidence or clogged sinkholes impede drainage. These events are increasing in frequency and severity due to regional climate trends, which elevate the risk for both urban and rural communities. (See BRADD’s work with AT&T’s Climate Resilient Communities Program and the Climate Risk and Resilience (ClimRR) Portal for a more in-depth look at how flooding is expected to be impacted by climate change throughout the region.)
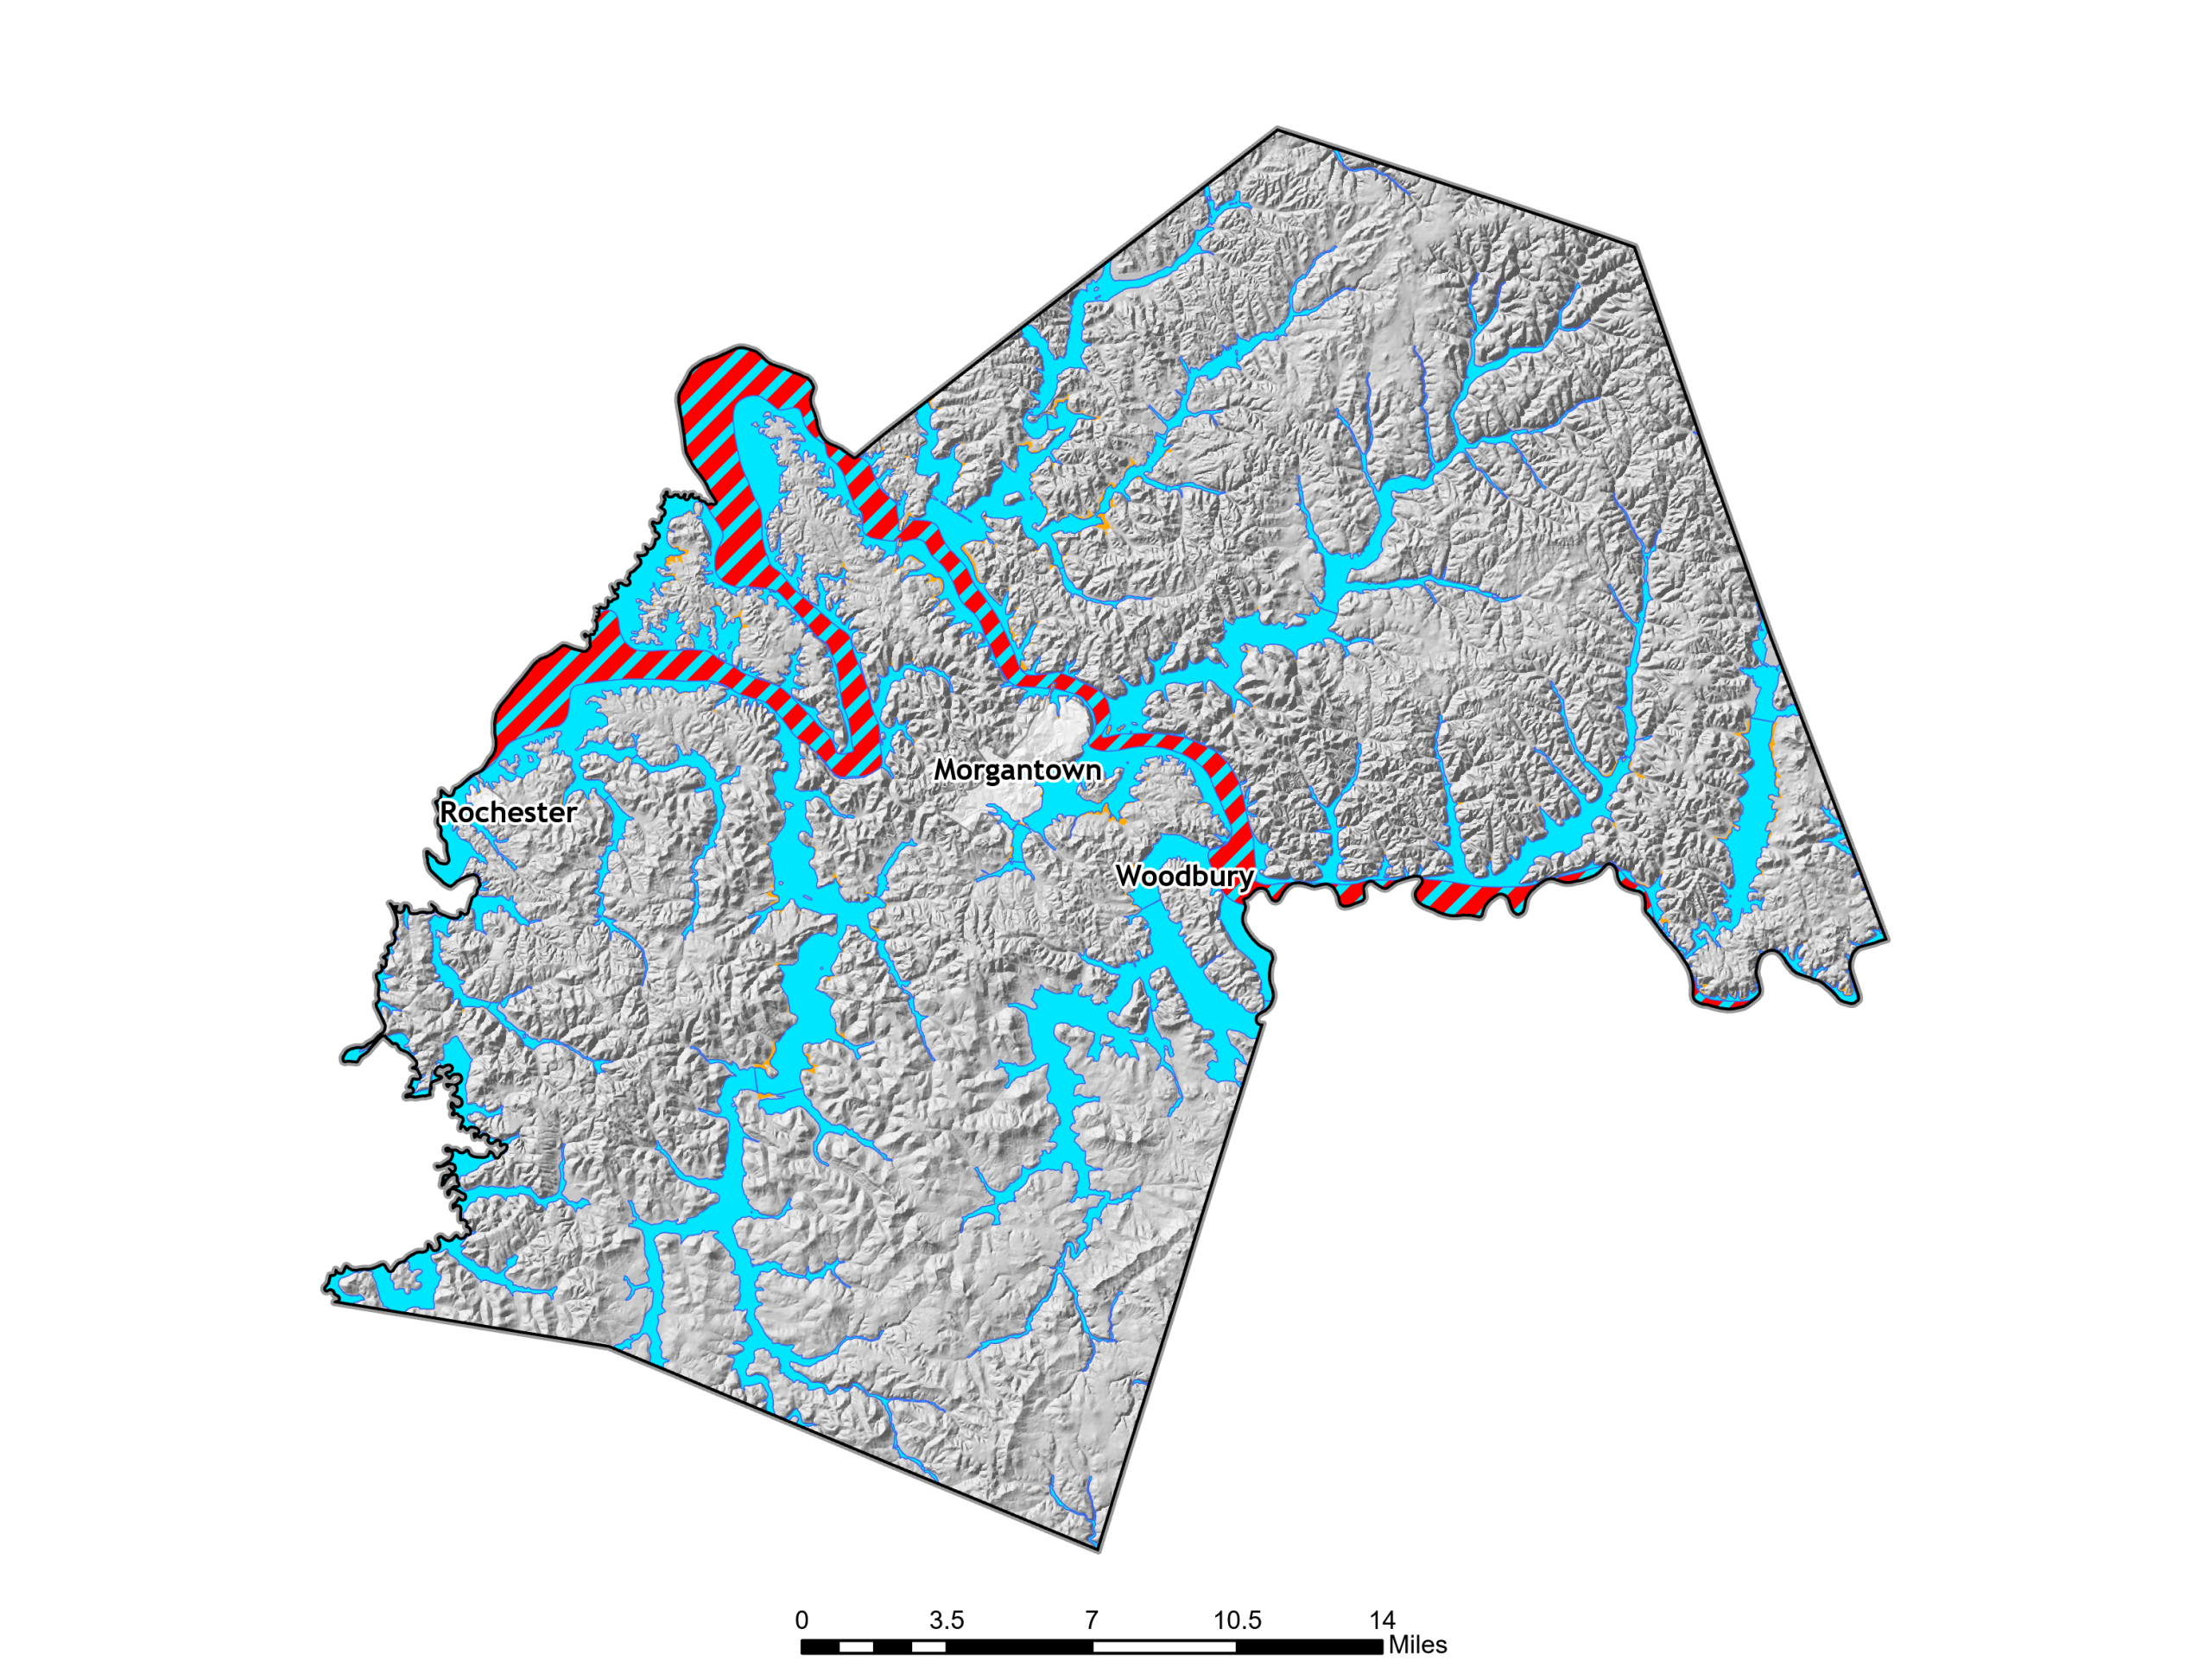

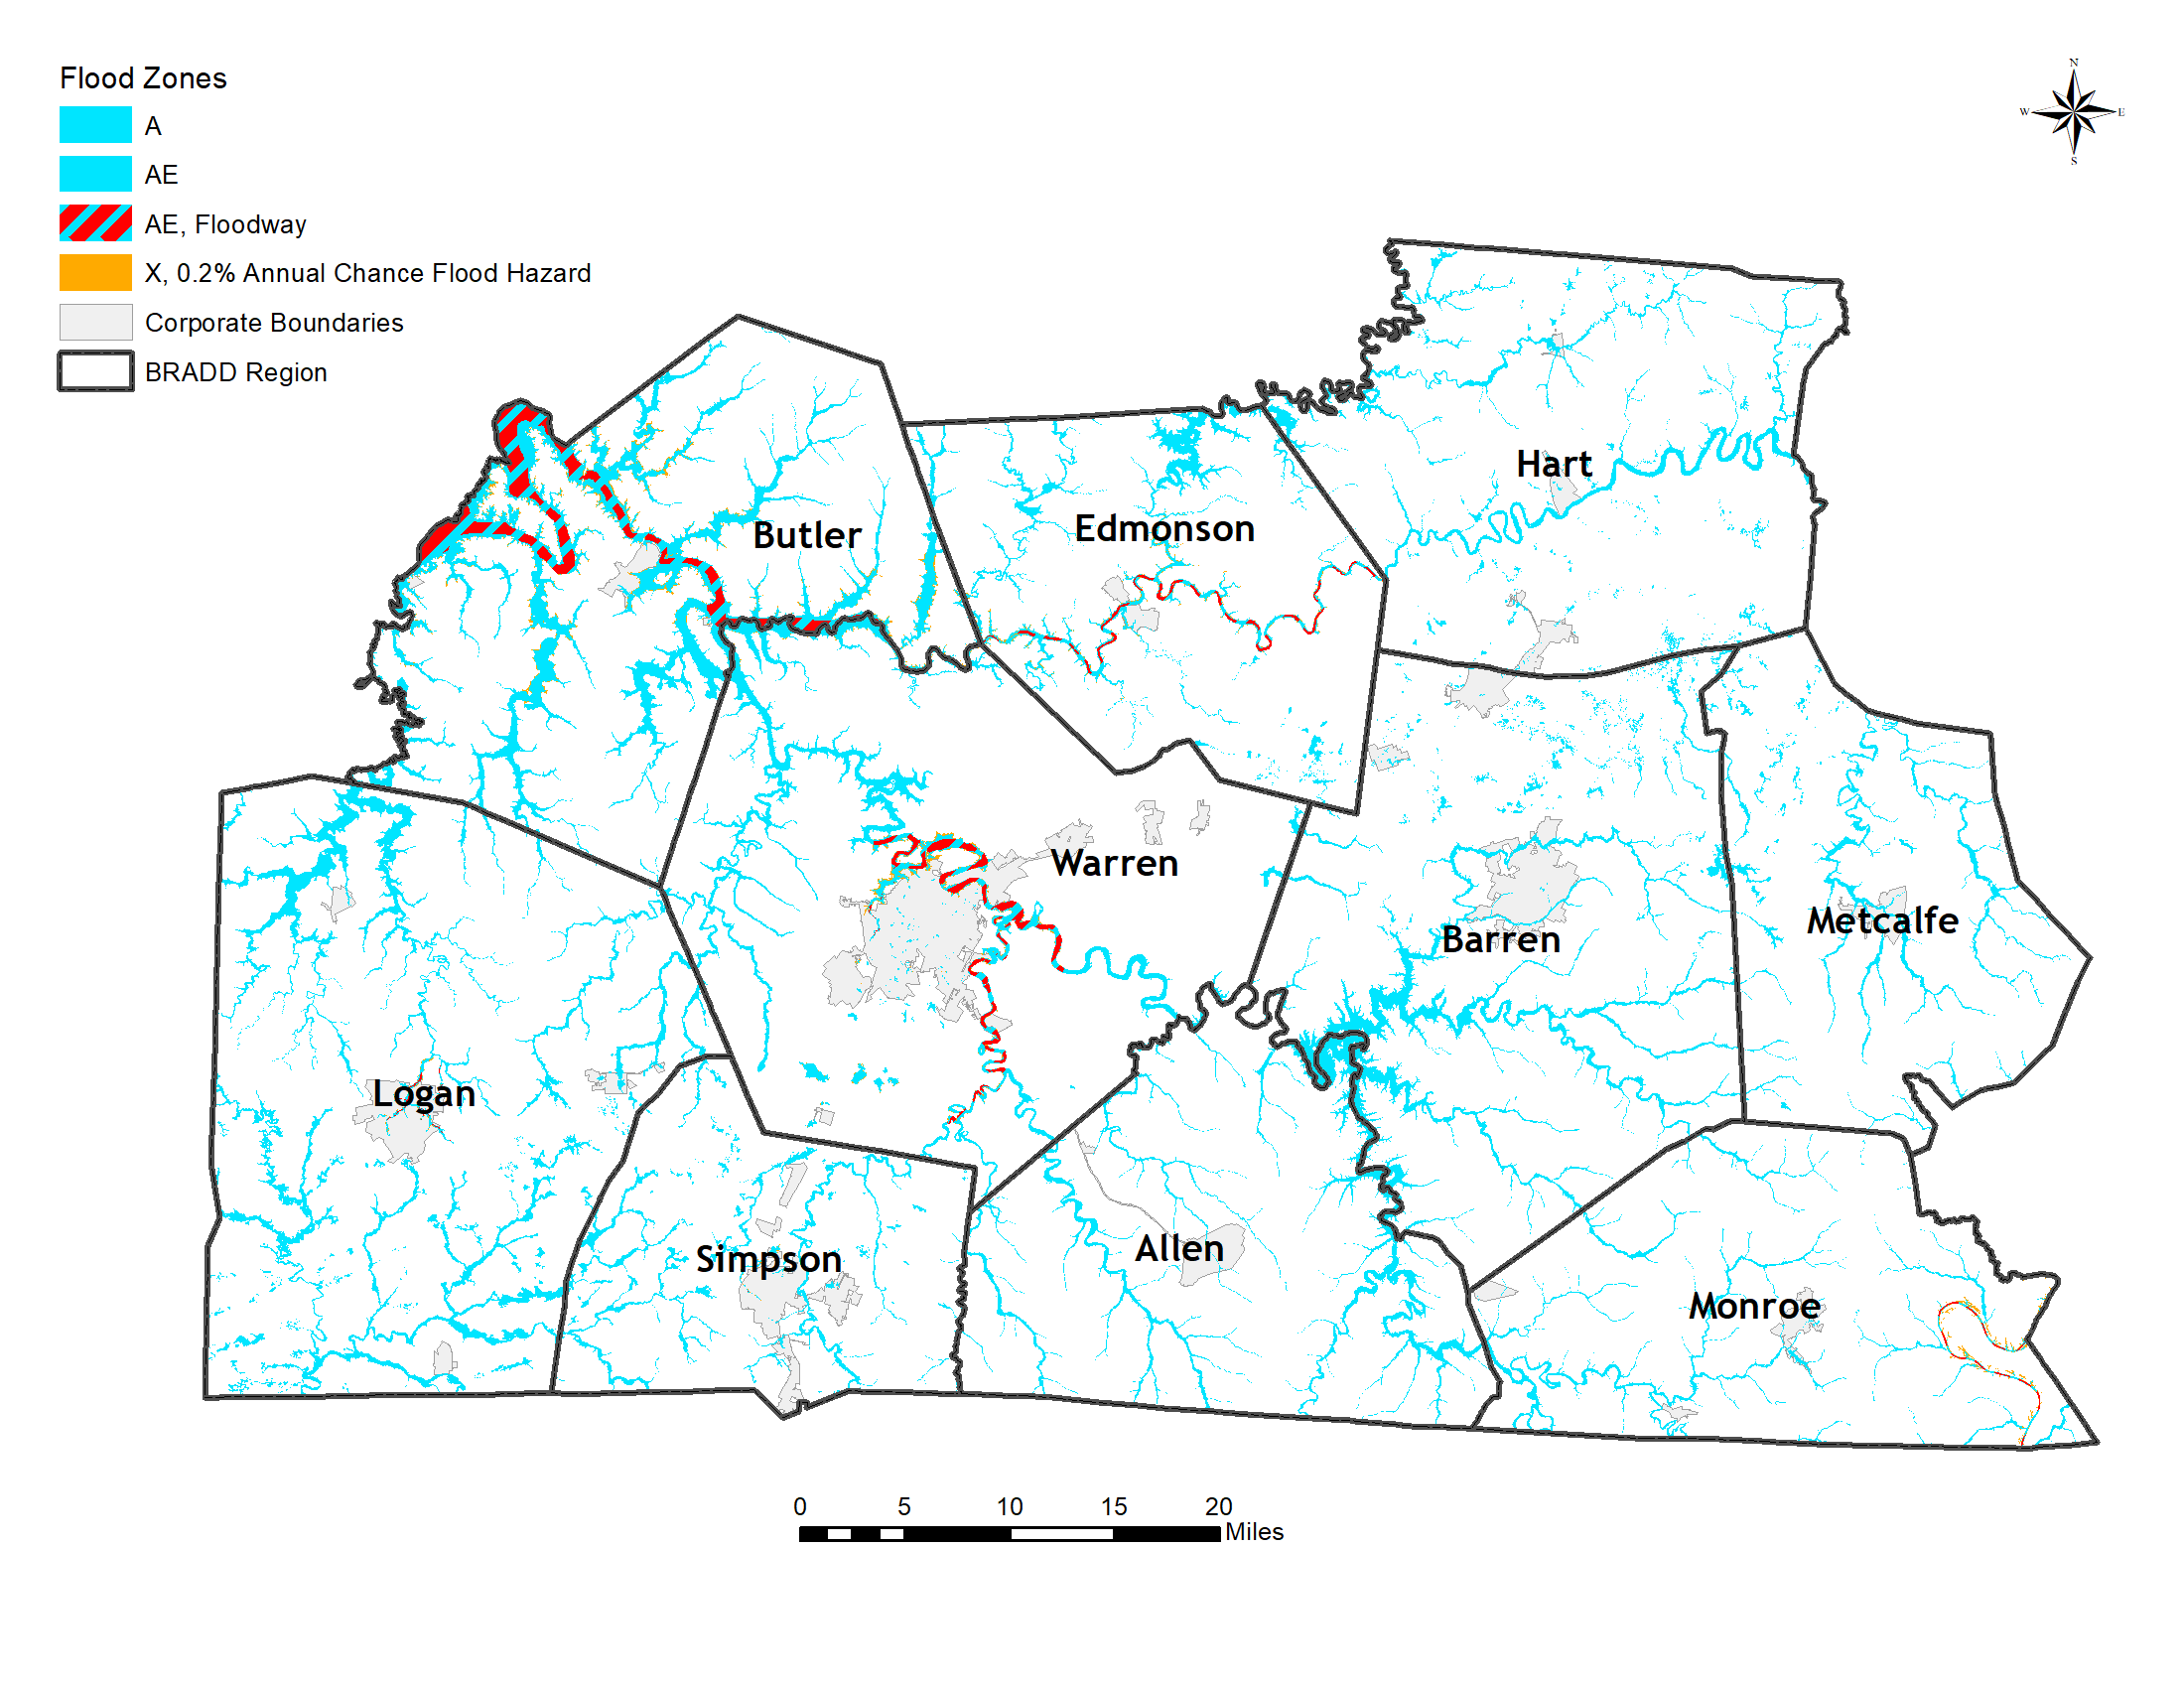
Location and Extent
Flood-prone areas in Butler County include low-lying and river-adjacent locations along the Green River, Barren River, and their tributaries, as well as rural road crossings and agricultural lands within these floodplains. The First Street Foundation estimates that approximately 12.4% of properties in Butler County have at least a 1-in-4 chance of flood damage over the next 30 years, with potential flood depths exceeding three feet in some neighborhoods with limited elevation or poor drainage. Models from the Climate Risk and Resilience Portal (ClimRR) project a 5–10% increase in the annual number of days with extreme precipitation (greater than one inch per day) by the mid-21st century under moderate-emissions scenarios, suggesting a rising likelihood of flash-flooding events during the spring and summer storm seasons.
Repetitive-loss (RL) and severe repetitive-loss (SRL) properties within Butler County are limited but notable. The unincorporated county contains four (4) such properties, all classified as single-family occupancy. Under National Flood Insurance Program (NFIP) definitions, all four meet the criteria for Repetitive-Loss, and two (2) also qualify as Severe Repetitive-Loss under both the NFIP and Flood Mitigation Assistance (FMA) definitions. The City of Morgantown has one (1) recorded single-family property that has experienced repeated flood claims but currently does not meet NFIP or FMA thresholds for RL or SRL classification. The Cities of Rochester and Woodbury currently possess zero (0) RL or SRL properties under either definition.
These data indicate that, while Butler County’s flood exposure is concentrated along its river corridors, its overall number of repetitive-loss structures remains low relative to regional totals. Nevertheless, as extreme-rainfall events become more frequent, continued mitigation investments—such as drainage improvements, structure elevation, voluntary acquisition where cost-effective, and strict NFIP compliance—will remain essential for protecting property and reducing future losses.
Historical Occurances
Butler County experienced 68 flood events over 20 years (~3.4 events/year). This places Butler in the upper-range of regional flood frequency.
Exposure in Butler County is countywide, with riverine flooding along the Green River, Barren River, and associated tributaries; flash flooding in small headwater basins and at rural road crossings; and urban or poor-drainage flooding within the Cities of Morgantown, Rochester, and Woodbury; and low-lying developed areas near the river corridor. While the county’s geology features fewer pronounced karst formations than portions of the eastern BRADD region, sinkholes and losing streams are still present in some upland areas and can concentrate stormwater, leading to rapid, localized inundation when drainage is obstructed or soils are saturated.
Click Here to view a summary of all past Disaster Declarations in the BRADD Region.
Below you will find a listing of past NOAA Flood and Flash-Flood Events from 2000-2020 for Butler County.
Butler County Flood Events
| EVENT_ID | CZ_NAME_STR | Jurisdiction | DATE | BEGIN_TIME | EVENT_TYPE | DEATHS_DIRECT | INJURIES_DIRECT | DAMAGE_PROPERTY_NUM | DAMAGE_CROPS_NUM | EVENT_NARRATIVE | EPISODE_NARRATIVE |
|---|---|---|---|---|---|---|---|---|---|---|---|
| EVENT_ID | CZ_NAME_STR | Jurisdiction | DATE | BEGIN_TIME | EVENT_TYPE | DEATHS_DIRECT | INJURIES_DIRECT | DAMAGE_PROPERTY_NUM | DAMAGE_CROPS_NUM | EVENT_NARRATIVE | EPISODE_NARRATIVE |
| 5,596,366 | ALLEN CO. | COUNTYWIDE | 3/1/1997 | 745 | Flash Flood | 0 | 0 | 0 | 0 | Widespread flash flooding across the county with numerous roads water covered. | |
| 5,596,781 | ALLEN CO. | COUNTYWIDE | 3/1/1997 | 1,800 | Flash Flood | 0 | 0 | 0 | 0 | 1 to 2 inches of rain on top of 3 to 7 inch less tha 24 hour totals resulted in widespread flash flooding with many roads closed and evacuations. | |
| 5,597,032 | ALLEN CO. | COUNTYWIDE | 3/5/1997 | 1,000 | Flash Flood | 0 | 0 | 0 | 0 | 1 to 3 inches of rain fell on top of already saturated grounds leading to widespread flash flooding with many roads water covered. | |
| 5,640,425 | ALLEN CO. | SCOTTSVILLE | ######## | 200 | Flood | 0 | 0 | 0 | 0 | DES reported several roads water covered and small creeks out of their banks. | |
| 5,640,431 | ALLEN CO. | COUNTYWIDE | ######## | 730 | Flash Flood | 0 | 0 | 0 | 0 | State police reported several roads water covered. | |
| 5,150,404 | ALLEN CO. | COUNTYWIDE | ######## | 2,025 | Flash Flood | 0 | 0 | 0 | 0 | ||
| 5,320,096 | ALLEN CO. | SCOTTSVILLE | ######## | 1,918 | Flash Flood | 0 | 0 | 0 | 0 | The remnants of Tropical Cyclone Isidore crossed Kentucky during the evening of September 26 into the early morning hours of September 27. The storm dropped heavy rains, particularly over parts of South Central Kentucky. Numerous county roads were covered by water in the area. Logan County was one of the hardest hit areas. Some bridges in the county were flooded over. Search and rescue in Russellville had to pump water out of city streets. In Ohio County, a number of county roads were covered by 6 inches of water, and the Western Kentucky Parkway at mile marker 70 was covered by 3 inches of water. City streets were flooded or closed in Bowling Green (Warren County), Morgantown (Butler County), Brownsville (Edmonson County), Beaver Dam and Hartford (Ohio County). | |
| 5,486,520 | ALLEN CO. | COUNTYWIDE | ######## | 229 | Flash Flood | 0 | 0 | 0 | 0 | A few county roads were covered with water. | |
| 29,977 | ALLEN CO. | SCOTTSVILLE | ######## | 1,645 | Flash Flood | 0 | 0 | 0 | 0 | Some roads in downtown Scottsville were closed due to the West Bays Fork flowing out of its banks. | A cold front brought bands of showers and thunderstorms to central Kentucky. |
| 68,744 | ALLEN CO. | MEADOR | ######## | 741 | Flood | 0 | 0 | 0 | 0 | Kentucky Route 1533 in the northern part of the county was closed due to high water. | An upper level disturbance produced some heavy rains over parts of east central and south central Kentucky. Flooding resulted, as ground had already been saturated by rains earlier in the week. |
| 93,743 | ALLEN CO. | HALIFAX | 4/3/2008 | 1,520 | Flood | 0 | 0 | 0 | 0 | Three or four roads across the county were closed due to high water. | A frontal system and upper level low brought widespread heavy rains and flooding to central Kentucky. |
| 93,745 | ALLEN CO. | HALIFAX | 4/4/2008 | 307 | Flood | 0 | 0 | 75000 | 0 | Numerous roads were closed due to high water, including two state highways. On Scottsville Road, the roof of a building collapsed due to the weight of ponded water. | A frontal system and upper level low brought widespread heavy rains and flooding to central Kentucky. |
| 174,907 | ALLEN CO. | SCOTTSVILLE | 5/9/2009 | 409 | Flash Flood | 0 | 0 | 0 | 0 | Water was reported over numerous roads with some roads closed. | Scattered thunderstorms brought heavy rainfall to south central Kentucky on May 9th. This area was already rain soaked from recent heavy rains and many streams and low lying areas began to flood. One fatality was reported with flooding in Simpson County when a man drove his pickup truck drove around a road block and into deep water. |
| 237,147 | ALLEN CO. | FOREST SPGS | 5/1/2010 | 2,230 | Flash Flood | 1 | 0 | 15000 | 0 | Heavy rains caused flash flood on Snake Creek Road near Maple Grove Church Road. One person died when he reportedly got out of a vehicle that was overcome by flood waters and was swept away. M34VE. | A stalled cold front over the Mississippi Valley spawned thunderstorms producing heavy rain from northern Mississippi through middle Tennessee and central Kentucky into southern Indiana. With little movement of the front, training of storms produced record or near-record 2-day rainfall totals from 8 to 10+ inches in many locations across central Kentucky. Major flooding occurred in at least 40 Kentucky counties, washing out roads and inundating municipal water treatment plants. Four lives were lost in Kentucky - three in vehicles and one in a home, where the resident was apparently electrocuted in high water. Over the following days, most area rivers were in flood, including some flooding along the main stem of the Ohio River. |
| 236,453 | ALLEN CO. | CEDAR SPGS | 5/2/2010 | 752 | Heavy Rain | 0 | 0 | 0 | 0 | A long time resident noted that water in the fiels was the highest he had seen in decades. The observer measured 5.7 inches in storm total precipitation since early May 1st. | A stalled cold front over the Mississippi Valley spawned thunderstorms producing heavy rain from northern Mississippi through middle Tennessee and central Kentucky into southern Indiana. With little movement of the front, training of storms produced record or near-record 2-day rainfall totals from 8 to 10+ inches in many locations across central Kentucky. Major flooding occurred in at least 40 Kentucky counties, washing out roads and inundating municipal water treatment plants. Four lives were lost in Kentucky - three in vehicles and one in a home, where the resident was apparently electrocuted in high water. Over the following days, most area rivers were in flood, including some flooding along the main stem of the Ohio River. |
| 237,610 | ALLEN CO. | MAYNARD | 5/2/2010 | 1,130 | Flash Flood | 0 | 1 | 15000 | 0 | Heavy rains continued to send flash flood waters over many roads in the county. A 72-year old male sustained a broken arm when flood waters washed his pickup off of KY Highway 482 near a bridge on Pleasant Ridge Church Road by the raging flood waters of Drakes Creek. A daring ladder truck rescue of the man from his truck - which was wedged into a fence by the flood waters - was captured on film by the editor of the local newspaper. | A stalled cold front over the Mississippi Valley spawned thunderstorms producing heavy rain from northern Mississippi through middle Tennessee and central Kentucky into southern Indiana. With little movement of the front, training of storms produced record or near-record 2-day rainfall totals from 8 to 10+ inches in many locations across central Kentucky. Major flooding occurred in at least 40 Kentucky counties, washing out roads and inundating municipal water treatment plants. Four lives were lost in Kentucky - three in vehicles and one in a home, where the resident was apparently electrocuted in high water. Over the following days, most area rivers were in flood, including some flooding along the main stem of the Ohio River. |
| 258,461 | ALLEN CO. | RED HILL | ######## | 1,300 | Flood | 0 | 0 | 0 | 0 | Water over KY 585 between mile markers 7 and 8 led to the road being closed. | A stalled frontal boundary stretched from south central to eastern Kentucky on the morning of August 18. Tropical moisture streaming north over the boundary enhanced by an upper level shortwave led to rounds of heavy showers and thunderstorms across south central Kentucky. Torrential rainfall produced flash flooding and flooding across this area. |
| 287,130 | ALLEN CO. | RED HILL | ######## | 2,320 | Flash Flood | 0 | 0 | 0 | 0 | Old Franklin Rd. was closed at several locations due to flooding. | A low pressure system tracked from Texas across Kentucky during the afternoon and evening of Feb. 24. The warm front associated with this low was able to move north to around the Bluegrass Parkway with the cold front sweeping through overnight. Despite limited instability, strong low level winds and shear were enough to support some severe thunderstorms across south central Kentucky. In addition, with precipitable water values near 1.5 inches, these storms were able to produce heavy rains. This led to flash flooding across south central Kentucky as well. |
| 303,444 | ALLEN CO. | RED HILL | ######## | 330 | Flash Flood | 0 | 0 | 0 | 0 | Dispatch reported road closures on KY 585, Old Franklin Rd., between mile markers 7 and 8. | A slow moving low pressure system tracked across southeastern KY on April 12. Ample moisture from the Gulf of Mexico wrapped around this vertically stacked low pressure system into central Kentucky. A deformation band set up across this area. Four to 5 inches of rain fell in parts of central Kentucky leading to many reports of flash flooding and impassable roads. |
| 303,451 | ALLEN CO. | MEADOR | ######## | 430 | Flash Flood | 0 | 0 | 0 | 0 | Dispatch reported road closures on KY 1533, Meador Port Oliver Rd., between mile markers 0 and 3. | A slow moving low pressure system tracked across southeastern KY on April 12. Ample moisture from the Gulf of Mexico wrapped around this vertically stacked low pressure system into central Kentucky. A deformation band set up across this area. Four to 5 inches of rain fell in parts of central Kentucky leading to many reports of flash flooding and impassable roads. |
| 367,776 | ALLEN CO. | ADOLPHUS | ######## | 1,536 | Flash Flood | 0 | 0 | 30000 | 0 | Allen County emergency management reported flash flooding near the intersection of Stafford Hollow Road and Andrew Jackson Highway. Several feet of water entered one home, making it uninhabitable. Several other homes were damaged. | In the wake of an early morning convective complex that brought isolated wind damage to south central Kentucky on April 26th, strong instability developed by afternoon. Scattered strong thunderstorms developed by mid afternoon. These storms brought large hail and isolated wind damage to basically the same area affected by storms earlier in the day. One isolated case of flash flooding developed as a result of training storms across Allen County. |
| 429,551 | ALLEN CO. | ALONZO | ######## | 855 | Flood | 0 | 0 | 0 | 0 | The Allen County Emergency Manager reported that several roads in the town of Scottsville became impassable due to high water. These roads include Old Hartsville and Jefferson School Road. He relayed an unconfirmed report that a portion of Alonzo Long Hollow Road near state Highway 100 was washed away. | Low pressure moved across southern Indiana during the early morning hours March 18th. Widespread showers and embedded thunderstorms developed across central Kentucky during the early morning hours ahead of a cold front that would approach the Ohio River later that afternoon. Several episodes of thunderstorms formed and moved northeast along an axis across south central Kentucky, roughly stretching from Logan to Casey Counties. In general, 2 1/2 to 3 inches of rain fell across Warren, Barren, Metcalfe, Allen, Casey and Adair Counties, leading to minor flooding of intersections and low water crossings. Several days later, several larger main-stem rivers went into flood. |
| 451,001 | ALLEN CO. | SCOTTSVILLE | 7/5/2013 | 1,503 | Flood | 0 | 0 | 0 | 0 | Holland Road east of Scottsville was impassable due to high water. | An anomalous upper air pattern developed July 3rd as a deep trough over the Lower Ohio Valley became cutoff and essentially retrograded westward over the lower Missouri Valley. As this trough moved westward, southerly flow between it and strong high pressure off the mid-Atlantic seaboard brought tropical moisture northward across the Tennessee and Lower Ohio Valleys. Despite widespread cloudiness and cool temperatures, repeated tropical showers from July 4th through the 6th brought several episodes of localized flash flooding across the Commonwealth. Some river flooding developed during subsequent days on the Rolling Fork and Green Rivers. |
| 583,633 | ALLEN CO. | POPE | 7/2/2015 | 600 | Flood | 0 | 0 | 0 | 0 | An official with KYTC District 3 reported that KY 585 between mile points 6-7, KY 1332 between mile points 3-5, KY 2160 between mile points 0-1 and KY 1533 between mile points 0-1 were closed from flooding. | A stalled front draped across north central Kentucky combined with a very moist and humid air mass and upper level weather systems to produce several rounds of slow moving thunderstorms. The repeated episodes of thunderstorms on top of already saturated ground from recent above normal precipitation resulted in flash flooding across parts of central Kentucky. |
| 581,233 | ALLEN CO. | HOLLAND | 7/5/2015 | 756 | Flash Flood | 0 | 0 | 0 | 0 | A law enforcement official reported that excessive rainfall and intense rain rates resulted in flooding along KY 100. This high water threatened a home along KY 100 as well. | An upper level disturbance and associated surface low pressure moved from the southern Plains northeastward toward the Tennessee and lower Ohio valleys Sunday July 5th. Isolated slow moving thunderstorms developed across south-central Kentucky, the worst of which fell in Simpson County. Several roads were closed and water rescues were performed. |
| 581,235 | ALLEN CO. | SCOTTSVILLE | 7/5/2015 | 800 | Flash Flood | 0 | 0 | 0 | 0 | An Allen County law enforcement official reported that several streets across town were were flooding and becoming impassable as a result of intense rain rates and excessive amounts of rainfall. | An upper level disturbance and associated surface low pressure moved from the southern Plains northeastward toward the Tennessee and lower Ohio valleys Sunday July 5th. Isolated slow moving thunderstorms developed across south-central Kentucky, the worst of which fell in Simpson County. Several roads were closed and water rescues were performed. |
| 581,236 | ALLEN CO. | SCOTTSVILLE | 7/5/2015 | 800 | Flash Flood | 0 | 0 | 0 | 0 | A public report was received of flooding and high water at the Green Valley Apartments in Scottsville. | An upper level disturbance and associated surface low pressure moved from the southern Plains northeastward toward the Tennessee and lower Ohio valleys Sunday July 5th. Isolated slow moving thunderstorms developed across south-central Kentucky, the worst of which fell in Simpson County. Several roads were closed and water rescues were performed. |
| 581,238 | ALLEN CO. | SCOTTSVILLE | 7/5/2015 | 821 | Flash Flood | 0 | 0 | 5000 | 0 | A trained spotter reported that a water rescue took place on Old Glascow Road as a result of intense rain rates and excessive rainfall amounts that flooded the road. | An upper level disturbance and associated surface low pressure moved from the southern Plains northeastward toward the Tennessee and lower Ohio valleys Sunday July 5th. Isolated slow moving thunderstorms developed across south-central Kentucky, the worst of which fell in Simpson County. Several roads were closed and water rescues were performed. |
| 581,239 | ALLEN CO. | SCOTTSVILLE | 7/5/2015 | 822 | Flash Flood | 0 | 0 | 0 | 0 | A trained spotter reported that because of high water and flash flooding, Old Hartsville Road was closed. | An upper level disturbance and associated surface low pressure moved from the southern Plains northeastward toward the Tennessee and lower Ohio valleys Sunday July 5th. Isolated slow moving thunderstorms developed across south-central Kentucky, the worst of which fell in Simpson County. Several roads were closed and water rescues were performed. |
| 642,180 | ALLEN CO. | NEW ROE | 7/5/2016 | 1,918 | Flash Flood | 0 | 0 | 0 | 0 | The Allen County emergency manager reported numerous roads under water across southwest Allen County. Many roads were impassable including Stoney Point Road around the Alonzo and Adolphus areas. | A stalled frontal boundary across central Kentucky combined with very warm temperatures and high moisture resulted in several rounds of organized strong to severe storms across central Kentucky during the afternoon and evening hours July 5-7. In addition to widespread wind damage, downed trees and power lines, the repeated episodes of heavy rain resulted in flash flooding as well as river flooding across southern Kentucky. |
| 687,766 | ALLEN CO. | SCOTTSVILLE | ######## | 740 | Flash Flood | 0 | 0 | 0 | 0 | Over 4 inches of rain fell in a short period which resulted in numerous reports of flooding. | An extremely warm, moist, and unstable air mass resided over the lower Ohio Valley during the middle of May. As a series of strong weather systems passed through the region, rounds of strong to severe thunderstorms developed and tracked across central Kentucky. |
| 687,768 | ALLEN CO. | SCOTTSVILLE | ######## | 800 | Flash Flood | 0 | 0 | 0 | 0 | Nearly 5 inches of rain was observed by the Kentucky Mesonet station near Scottsville. There were numerous reports of flooding. | An extremely warm, moist, and unstable air mass resided over the lower Ohio Valley during the middle of May. As a series of strong weather systems passed through the region, rounds of strong to severe thunderstorms developed and tracked across central Kentucky. |
| 687,770 | ALLEN CO. | SCOTTSVILLE | ######## | 817 | Flash Flood | 0 | 0 | 0 | 0 | The Allen County COOP Observer reported flash flooding in Scottsville. There were many roads closed due to high water. | An extremely warm, moist, and unstable air mass resided over the lower Ohio Valley during the middle of May. As a series of strong weather systems passed through the region, rounds of strong to severe thunderstorms developed and tracked across central Kentucky. |
| 687,772 | ALLEN CO. | SCOTTSVILLE | ######## | 840 | Flash Flood | 0 | 0 | 0 | 0 | The Allen County Emergency Manager reported numerous roads closed throughout the county due to flash flooding. | An extremely warm, moist, and unstable air mass resided over the lower Ohio Valley during the middle of May. As a series of strong weather systems passed through the region, rounds of strong to severe thunderstorms developed and tracked across central Kentucky. |
| 800,061 | ALLEN CO. | MAYNARD | ######## | 1,745 | Flash Flood | 0 | 0 | 0 | 0 | Water was reported over the road at Whitney Road and Parkhurst Road. | On February 19, 2019, a broad upper trough dipped south to the Gulf of Mexico and carried abundant amounts of moisture towards the Ohio Valley. Once the moisture was transport was underway, isentropic lift caused 1.5 to 3 of rainfall along the Mississippi and Ohio River Valleys. The higher amounts went as far north as south central Indiana.||On the 20th, an upper trough axis and cold front pushed through southern Indiana and central Kentucky. The heaviest rain fell during the morning and into the afternoon hours before tapering off from west to east late on the 20th.||Moving into the 22nd, the upper flow amplified once again with a deep southwest flow aloft. Isentropic lift was underway resulting in widespread light rain pushing northward from Tennessee into Kentucky during the day. By that night, the ridge increased slightly across the region with a surface warm front pushing northward. More moderate to heavy rainfall fell during the night which caused localized flooding. ||On the evening of the 23rd, surface low pressure in the vicinity of the Kansas City, MO area with an arcing cold front pushed towards the Mississippi River. This cold front pushed through the region during the night and brought more moderate to heavy |rain along with some thunderstorms. ||All this rain and the saturated ground caused many flooding problems around central Kentucky. |
| 878,619 | ALLEN CO. | RED HILL | ######## | 2,016 | Flood | 0 | 0 | 0 | 0 | There were reports of flooding on roads near Highway 585 and West Old State Road. | During the evening of the 12th, a low pressure system moved towards central Kentucky from the southwest. This brought an inch or two of rain to the area. As a result reports of flooded roadways came in from Allen and Jefferson Counties. A flood watch was in effect at the time. |
| 878,620 | ALLEN CO. | MEADOR | ######## | 2,016 | Flood | 0 | 0 | 0 | 0 | There was a report of flooding on Highway 1533. | During the evening of the 12th, a low pressure system moved towards central Kentucky from the southwest. This brought an inch or two of rain to the area. As a result reports of flooded roadways came in from Allen and Jefferson Counties. A flood watch was in effect at the time. |
| 1,188,687 | ALLEN CO. | FOREST SPGS | 2024-05-09 | 2 | Flash Flood | 1 | 0 | 0.00K | 0.00K | A 56 year old male attempted to cross the Blankenship Road bridge over Trammel Creek in southern Allen County. His vehicle was swept away and his body was found in the flood waters later on May 9th. | On May 8th and 9th, 2024, a quasi-stationary frontal boundary was draped from west to east across the Ohio Valley. Storms from the previous evening across southern Indiana and north central Kentucky had helped to stabilized the environment in those locations, though areas in southern Kentucky still had a good amount of instability and shear to work with during the afternoon and evening hours on May 8th. Early in the afternoon, discrete cells, with some supercells, produced hail and some rotation, though no tornadoes were reported. By mid-to-late afternoon, most of the storms merged into multicell clusters with some bowing lines producing scattered wind damage. Late in the evening into the early morning hours of May 9th, continued waves of heavy rainfall produced considerable flash flooding along the Kentucky and Tennessee border, resulting in one fatality in Allen County. |
| 1,188,688 | ALLEN CO. | PETROLEUM | 2024-05-09 | 3 | Flash Flood | 0 | 0 | 0.00K | 0.00K | Two water rescues had to be performed, and numerous roads were closed across Allen County due to flash flooding. | On May 8th and 9th, 2024, a quasi-stationary frontal boundary was draped from west to east across the Ohio Valley. Storms from the previous evening across southern Indiana and north central Kentucky had helped to stabilized the environment in those locations, though areas in southern Kentucky still had a good amount of instability and shear to work with during the afternoon and evening hours on May 8th. Early in the afternoon, discrete cells, with some supercells, produced hail and some rotation, though no tornadoes were reported. By mid-to-late afternoon, most of the storms merged into multicell clusters with some bowing lines producing scattered wind damage. Late in the evening into the early morning hours of May 9th, continued waves of heavy rainfall produced considerable flash flooding along the Kentucky and Tennessee border, resulting in one fatality in Allen County. |
| 1,237,989 | ALLEN CO. | SCOTTSVILLE | 2025-02-15 | 10 | Flash Flood | 0 | 0 | 0.00K | 0.00K | Numerous roads were impassable across Allen County due to flash flooding. | A strong storm system moved across the Ohio and Tennessee Valleys on February 15th and 16th, 2025, bringing heavy rainfall and flooding, severe weather, and winter weather to central Kentucky. The large scale upper level pattern featured deep troughing ejecting across the central CONUS, with broad southwesterly flow occurring in the low and mid troposphere. Southerly flow helped to draw rich moisture up from the Gulf of America, with unseasonably high precipitable water for the middle of February, generally between 1.1 and 1.3 inches, overspreading the Tennessee and Kentucky. A nearly stationary surface front extending from west to east across the lower Ohio Valley provided a source for lift as warm and humid air ascended over a cool near surface layer. Light to moderate rain developed across the region early on the morning of the 15th, with rainfall getting heavier across south central Kentucky by around daybreak. This resulted in instances of flash flooding occurring across south central Kentucky during the mid-to-late morning hours. As the main surface low pressure system approached from the southwest during the afternoon on the 15th, the quasi-stationary surface front lifted into north central Kentucky, bringing a brief reprieve from rain across southern Kentucky while rainfall increased across northern Kentucky. As a broken line of storms developed ahead of an approaching cold front, temperatures and dewpoint temperatures increased considerably across southern Kentucky. This allowed for enough instability for a few strong to severe storms to develop near the Tennessee border. One portion of the line of storms produced a brief tornado over Simpson County, while other reports of wind damage and hail were received from Warren, Logan, and Monroe County. Still, heavy rainfall was the predominant impact from this system, as numerous instances of flooding and flash flooding were observed across Kentucky, and river flooding would occur over the following week. February 17th, one person drove into flood water and drown in Ohio County. Precipitation ended as a band of light to moderate snow on the morning of the 16th, producing accumulations of 1 to 3 inches before ending. |
| 1,267,538 | ALLEN CO. | MEADOR | 2025-05-20 | 17 | Flash Flood | 0 | 0 | 0.00K | 0.00K | Meader-Port Oliver Road was impassable due to flowing water over the roadway. | A negatively-tilted upper-level trough extended from the northern Great Plains down into the lower Ohio Valley on May 20th, bringing a strong cold front through the mid-Mississippi and Ohio Valleys. Showers and storms moved across the region along a warm front during the morning hours, limiting heating somewhat; however, a break in the precipitation during the early-to-mid afternoon hours allowed temperatures to warm into the upper 70s and low 80s with dewpoint temperatures in the upper 60s and low 70s. This lead to the development of around 2500 J/kg surface-based CAPE, which was combined with 50-55 knots of effective bulk shear to create an environment which was supportive of strong, organized convection. |
Probability of Future Events
Given the historical record, Butler County should plan for recurring annual flood potential, with variability by season and storm track. Regionally, counties show a 70–400% “annual chance” framing based on events per year; Butler’s~3.4 events/year indicates regular exposure that warrants ongoing maintenance of drainage systems, culverts, and roadway low-water crossings.
Impact
Extreme heat can lead to heat exhaustion and heatstroke, particularly in outdoor workers, the elderly, and low-income households without access to cooling. It also increases energy demand, raising utility costs and the likelihood of power outages. Severe cold poses risks of frostbite, hypothermia, and infrastructure damage, including frozen pipes and malfunctioning heating systems. Both extremes can disrupt agricultural yields, livestock health, and local economies.
Built Environment:
Flooding can cause structural damage to both residential and commercial buildings and destroy furnishing and inventory.
Flooding will causes inconvenience or stoppage to many system. Transportation systems such as roads and railways become unpassable. Large amounts of water from a flood can affect water management systems such as the backup or hiatus of drainage, sanitary, and sewer systems. As heavy rains persist during a flood event, excess water drains into the ground water system. This causes the water table to rise and cause further ground water floods. If chemicals are mixed with flood waters, this can contaminate the ground water, a common source of fresh water for communities.
Natural Environment:
As flood waters engulf the surrounding natural environment, they are saturated with chemicals and other substances associated with the manmade environment that they have also been in contact with. As these abnormal waters settle and flows through natural ecosystems they can alter and even destroy both plant and animal life. When the flow of flood waters becomes so immense, it can physically destroy or uproot naturally growing vegetation and also drive specific species of animals out of their natural habitats for good.
Social Environment:
People
People with property located in the floodplain or within areas subject to seepage are vulnerable to flooding. Stoppage to transportation systems can make it very difficult for isolated populations to receive aid or escape breeching flood waters. Vulnerable populations, such as the elderly or people who need medical attention, may be temporarily cut off from accessing life-saving resources.
Economy
Floods can affect local economies by disrupting transportation systems needed for people to get to and from work and destroying places of business and means of production. When flooding occurs in more rural areas, livestock and agricultural system will be affected. Crops can be destroyed in the growing season, or prevent from seeding in the off season. Large insurance payouts to residents or business owners who have procured flood insurance might also have an economic impact.
Climate Impacts on Flooding:
Climate change models predict and increase in overall temperature globally for the coming decades, including the BRADD region. With a potential rise of several degrees Fahrenheit, multiple services, systems, and activities face disruption and impact. Temperature increases this small may not seem threatening, but the cumulative impacts will affect weather events, human health, and ecosystem functions, along with economic and social issues related to energy use and cost of living.
Working with
AT&T’s Climate Resilient Communities Program and the
Climate Risk and Resilience (ClimRR) Portal, BRADD identified additional opportunities for hazard mitigation action items associated with climate impacts for flooding in the Barren River Region. To view an interactive report of these findings,
click here.
Butler County’s vulnerability to flooding is concentrated along the Green River and Barren River corridors, at low-water crossings, and in areas of limited drainage capacity within the City of Morgantown and unincorporated rural communities. Manufactured housing areas, older homes with minimal elevation or foundation freeboard, critical facilities located near the Special Flood Hazard Area (SFHA), and small businesses with ground-level inventories are particularly sensitive to inundation. Residents with limited mobility, vehicle access, or medical dependencies face elevated functional risk when roadways flood or power service is disrupted. While Butler County’s karst landscape is less pronounced than in some eastern BRADD counties, sinkholes and losing streams in upland areas can still cause sudden, localized flooding if inlets become obstructed. Rural private well users may experience post-flood water-quality concerns. Targeted mitigation—such as culvert and ditch maintenance or upsizing, low-water crossing signage and sensors, backflow prevention, structure elevation or acquisition where feasible, and ongoing public outreach on flood safety—helps reduce losses and maintain community access.
Overall vulnerability is defined using FEMA’s standard classification criteria for exposure, frequency, and consequence.
Butler County faces a high level of vulnerability to flooding, supported by 68 documented flood events between 2000 and 2020 and several FEMA Disaster Declarations affecting the county, including major floods in 1997, 2010, 2021, and 2023. The county’s combination of major river systems, low-lying agricultural lands, and drainage challenges contributes to recurring risk across both rural and developed areas. Among its jurisdictions, the City of Morgantown experiences the lowest exposure, with seven recorded flood and flash-flood events since 2000, resulting in a medium vulnerability classification. The Cities of Rochester, with 23 event, and Woodbury, with 38 recorded events, are each considered to have high vulnerability to flooding.
Between 2000 and 2020, Butler County has had 68 flood events.
Butler County has received FEMA Disaster Declarations as a result of flooding in 2004 (2), 2009, 2010, 2011, 2015, 2016, 2018, 2019, 2020 (2), and 2023.
Overall, Butler County experiences very high vulnerability to flood events. The risk for Butler County’s cities is analyzed below.
The City of Morgantown has had seven historic occurrences of flood and flash-flood events since 2000. Its vulnerability is medium.
The City of Rochester has had twenty-three (23) historic occurrences of flood and flash-flood events since 2000. Its vulnerability is high.
The City of Woodbury has had thirty-eight (38) historic occurrences of flood and flash-flood events since 2000. Its vulnerability is high.
Hazardous Material in Butler County
Background
The Environmental Protection Agency (EPA) defines hazardous materials as liquid, solid, contained gas, or sludge wastes that contain properties that are potentially harmful to human health or the environment. Hazardous materials are typically released in the form of spills, leaks, or vapor emission. These are known as either a point source release that can be traced back to a single origin, or a non-point source releases that occur incrementally, slowly polluting the environment.
These chemicals are used in industry, agriculture, medicine, research, and consumer goods. Hazardous materials come in the form of explosive flammable and combustible substances, poisons, and radioactive materials. In all its forms, hazardous materials can cause death, serious injury, long-lasting health effects, along with damage to buildings, homes, and other property.
Facilities that Contain Large Quantities of Hazardous Materials
Many products containing hazardous chemicals are used and stored in homes routinely. These products are also shipped daily on the nation’s highways, railroads, waterways, and pipelines. Varying quantities of hazardous materials are manufactured, used, or stored at an estimated 4.5 million facilities in the United States from local dry cleaning establishments, service stations, and garden supply stores to hospitals and major industrial plants. Facilities that contain large quantities of hazardous materials are regulated to reduce the risk of point source spills. These facilities are categorized as Tier II facilities, which are defined as those that are equal or exceed the thresholds of hazardous materials under Section 311(e) of Title III of the Superfund Amendments and Reauthorization Act (SARA).
Tier II facilities are required to complete a Tier II Emergency and Hazardous Chemical Inventory report by the Kentucky Emergency Response Commission (KyERC). These facilities are also required to report to the Local Emergency Planning Committee (LEPC) and local fire departments. Tier II storage facilities are required to comply with federal safety requirements and are regulated by the U.S. Environmental Protection Agency. Title III of SARA regulates the packaging, labeling, handling, storage and transportation of hazardous materials. The law requires facilities to furnish information about the quantities and health effects of materials used at the facility, and to promptly notify local and State officials whenever a significant release of hazardous materials occurs.
Other Federal laws that regulate hazardous materials include: Resource Conservation and Recovery Act of 1976 (RCRA), Hazardous Materials Transportation Act (HMTA), Occupational Safety and Health Act (OSHA), Toxic Substances Control Act (TSCA), Clean Air Act, and Norman Y. Mineta Research and Special Programs Improvement Act of 2004.
Location and Extent

The extent of a hazardous materials release is characterized by the type of substance, quantity released, state (gas, liquid, solid), dispersion behavior, and weather/terrain conditions. Releases may be constrained and local (e.g. a leaking drum or tank) or large and far-reaching (e.g. vapors spreading over multiple miles, groundwater contamination migrating). Depending on the chemical’s toxicity, volatility, and persistence, an incident could produce acute health effects, long-term environmental harm, or chronic exposure zones. In the BRADD region, credible scenarios include a small spill alongside a highway, a rail car release near populated areas, or a storage tank failure, each producing different spatial footprints and hazard zones.
Past Events
The BRADD region has a record of hazardous materials incidents, particularly associated with transportation and industrial operations. Kentucky has experienced several costly hazmat transit incidents in recent years. In rail transport, derailments involving chemical cargo have spurred evacuations and environmental response. For example, in 2007, a major derailment in Kentucky released hazardous materials and required area evacuation. Nationally and regionally, chemical spills from industrial plants have caused injury, property damage, and remediation efforts. Some incidents, such as the 1981 Louisville sewer explosions (driven by hexane vapors in sewer lines), illustrate how improper chemical disposal can lead to infrastructure destruction. These past events highlight the potential for both acute and lingering impacts of hazardous material releases.
Probability of Future Events
The probability of a hazardous materials incident in Butler County is moderate. Most releases tend to be small and localized due to equipment failure, human error, or transportation-related accidents. However, given the presence of chemical transport corridors (rail, interstate highways) and industrial facilities, the chance of a more serious event cannot be discounted. Natural hazards (storms, flooding) may also trigger secondary releases from damaged tanks or infrastructure. Planning for hazmat risk typically involves mapping potential release sites and integrating them into probabilistic risk models.
Impact
Hazardous materials releases can produce widespread and cascading effects across built, natural, and social environments.
Built Environment:
Buildings are vulnerable to a hazardous materials spill. The combination of fire, water, and chemicals could result in an explosion that is likely to damage both the buildings storing hazardous materials and the area surrounding the storage area. Proper storage and handling of these chemicals is critical in decreasing built environment vulnerability. A hazardous materials spill anywhere along the Barren River Region’s transportation network will have an immediate impact on travel time and delays. Municipal water systems and storm water drainage systems are vulnerable to a toxic spill. Chemicals that reach the water system could limit the supply of potable water.
Natural Environment:
Factors contributing to the vulnerability of natural systems are the type of chemical spilled the physical state of the chemical, the amount released, and the location of the incident. Vulnerability of the natural environment to hazardous materials events is higher for species and ecosystems in the immediate vicinity of the event, and moderate for those located downstream.
Social Environment:
People
A hazardous material spill could isolate parts of the region from critical facilities. Mobility impaired persons would be vulnerable to a spill or vapor release that requires immediate evacuation. Similarly, people with hearing or sight impairments may require special notification if the standard announcements are not available. Children with respiratory problems are at a higher risk of vulnerability to chemical vapors. Elderly with mobility impairments or compromised immune systems may suffer greater injuries in the case of a hazardous material release. Low-income residents are more likely to reside in closer proximity to hazardous facilities than wealthier counterparts. If displaced by a hazardous materials spill, limited income residents may face additional hardship.
Economy
Cost of replacing damaged property; a spill at a fixed facility , may cause temporary or permanent closure
Climate Impacts on Hazardous Material Spills:
As climate change impacts other sectors and hazards, such as increased severe storms, heat waves, and flooding, there is a chance that hazardous materials will become more unstable due to potential disasters. During flood events, materials may be spilled or introduced into waterways and severe wind or winter storms may cause the spillage of materials during vehicular accidents or building and infrastructure damage. Sinkhole openings may introduce hazardous materials into the groundwater system. An increased use in hazardous materials may also occur as part of other mitigation and adaptation activities, such as development, and may increase the exposure for these impacts to occur.
This hazard presents a moderate risk to Allen County, due to the large amount of manufacturing and development, sensitive groundwater and surface water resources, and the probability for severe events to occur.
Potential impacts include:
- increase spillage of hazardous materials
- more frequent transport and storage of hazardous materials
- threat to environmental and human health during a spill or contamination event
- threat from exposure during increased use to mitigate other impacts
- threat to infrastructure during a spill or other event
- economic loss from cleanup or health impacts
Vulnerability
Vulnerability to hazardous materials incidents in the Butler County spans the built, natural, and social environments. Facilities, pipelines, transport routes, and storage tanks located in or near populated areas are particularly exposed to risk. Ecological systems—including waterways and karst aquifers—are susceptible to contamination from chemical releases. Socially, communities with limited emergency response capacity, lower socioeconomic status, or older infrastructure may experience disproportionate harm and slower recovery. Understanding these vulnerabilities is critical to informing land-use controls, buffer zones, monitoring, and public awareness programs.
Butler County’s vulnerability is relatively low but notable along the William Natcher Parkway and local routes used for agricultural and petroleum transport. Rural characteristics and lower population density reduce overall
exposure, yet limited emergency response resources and long distances to specialized hazmat teams can delay containment. The Green River corridor also presents environmental sensitivity, as spills could affect aquatic
systems and downstream users.
Emerging Infectious Disease in Butler County
Description
An Emerging Infectious Disease (EID) is an emerging or re-emerging virus that has not reached the level of a pandemic. EIDs may primarily infect smaller pockets within a larger community due to some population immunity or limited contact. Because it has not reached a level of pandemic and, thus, fewer people have been infected, there will be more resources available to aid in response and recovery.
The Baylor University College of Medicine defines Emerging Infectious Disease, or EID, as “infections that have recently appeared within a population or those who incidence or geographic range is rapidly increasing or threatens to increase in the near future”. Recent outbreaks that have been classified as EID were SARS, MERS, Ebola, chikungunya, avian flu, swine flu, and zika. EIDs are an important consideration for public health professionals and local elected officials because they have been the cause of some of the deadliest pandemics in history, such as the 1918 Spanish Influenza and the HIV/AIDs outbreak.
Causes of Emerging Infectious Diseases
There are four primary causes for the emergence and spread of an infectious disease per the Baylor College of Medicine:
- Previously undetected or unknown infectious agents
- Known agents that have spread to new geographic locations or new populations
- Previously known agents whose role in specific diseases have previously gone unrecognized
- Re-emergence of agents whose incidence of disease had significantly declined in the past, but whose incidence of disease has reappeared. This class of diseases is known as re-emerging infectious diseases.
How Do Emerging Infectious Diseases Spread?
There are a myriad of ways in which EIDs can spread to and throughout the population. This subsection explores them by dividing them into two categories: direct versus indirect contact.
Direct Contact
Direct contact refers to when an individual is infected by another person or an animal that has the disease.
1. Person to Person – Person to person disease spread occurs when an individual makes direct contact with someone who has already contracted the disease through kissing, hugging, touching, coughing, or sneezing.
2. Animal to Person – Animal to person transfer can occur if a person is either bitten or scratched by an infected animal. Spread can also occur by handling animal waste.
3. Mother to Unborn Child – Germs that cause infectious disease can be spread to an unborn child while it is still in the womb by passing through the placenta or it can be transmitted during birth.
Indirect Contact
Indirect infectious disease spread occurs when the infection is spread through an inanimate object or by something that has not contracted the illness, but is simply a host.
Insect Bites – Some infectious diseases, such as malaria, are carried by insects and spread through bites. The insects that act as hosts to the disease is known as a vector.
Food Contamination – Food and water may be contaminated by a germ and human consumption is the point of contamination.
Extent
Emerging infectious disease (EID) outbreaks can range from small, localized clusters to countywide or multi-county epidemics, depending on the pathogen’s transmissibility (e.g., R₀), incubation/asymptomatic period, mode of transmission (airborne, droplet, contact, vector, food/water), clinical severity, and availability of countermeasures (vaccines/antivirals). Severity is often expressed through combinations of attack rate, hospitalization and ICU utilization, case fatality ratio, and the duration/number of waves, which together determine stress on healthcare, schools, businesses, and critical services. FEMA’s planning policy expects plans to describe a hazard’s type, location, and extent and to include previous occurrences and the probability of future events; for EIDs, this typically means using qualitative scales (e.g., low/moderate/high) informed by public-health surveillance and scenario analysis.
Past Events
Butler County’s EID context mirrors the region and state: 2009 H1N1 influenza produced widespread illness and vaccination campaigns; COVID-19 (2020–2022) caused repeated surges, remote learning periods, healthcare strain, and workforce disruptions across south-central Kentucky, with lingering recovery needs. At smaller scales, seasonal influenza, gastrointestinal outbreaks, hepatitis A, and tick-borne illnesses recur and periodically challenge local public-health capacity. For hazard-mitigation purposes, these events document that infectious hazards are recurring and can escalate quickly, even when initial clusters are small.
Location
EIDs are non-spatial at the county scale: exposure is countywide and follows human activity patterns. Transmission risk is elevated where people congregate or where mobility is high, including schools and childcare sites, long-term care and healthcare facilities, workplaces and distribution/logistics hubs, correctional settings, places of worship, and events/venues. Vulnerability may be higher for neighborhoods with older adults, people with chronic conditions, uninsured/under-insured residents, or limited access to primary care, and for settings with shared housing or limited ventilation.
The probability of emerging infectious disease (EID) activity in Butler County is ongoing and recurrent, though severity varies by pathogen. Routine outbreaks (e.g., novel respiratory viruses, GI pathogens) should be expected annually to every few years, with countywide transmission most likely during school terms, peak respiratory seasons, and periods of high mobility. The likelihood of a significant EID event (i.e., one that stresses healthcare and disrupts schools/workplaces) over a typical 5–10-year planning horizon is moderate, driven by regional travel corridors, congregate settings (schools, long-term care, workplaces), and periodic introductions from outside the region. Probability increases with factors such as low vaccination/booster uptake, limited access to primary care, and delayed detection, and decreases with strong surveillance, rapid testing, vaccination campaigns, and effective risk communication. Climate-related stressors (e.g., hotter summers, air-quality episodes, shifting vectors) can indirectly elevate transmission risk for certain diseases by increasing indoor crowding or extending vector seasons, but the dominant drivers for EIDs in Butler County remain human mixing patterns, healthcare capacity, and public-health interventions.
Impact
Emerging infectious diseases (EIDs) can trigger cascading consequences across systems even when case counts are moderate, because illness, isolation, and precautionary measures disrupt people, places, and services simultaneously. Direct health impacts (morbidity, mortality) are compounded by workforce absenteeism, supply-chain delays, and surges on healthcare and public health operations. The breadth of consequences depends on the pathogen’s transmissibility and severity, the speed of detection, and the availability of countermeasures (testing, treatment, vaccination) and risk communication.
Built Environment
EIDs strain the built environment indirectly by stressing the facilities and systems people operate. Hospitals, clinics, EMS stations, and pharmacies can exceed functional capacity, requiring surge spaces and changes to ventilation and patient flow. Public buildings, schools, and workplaces may need operational adjustments (enhanced cleaning, spacing, HVAC improvements), and staffing gaps can delay maintenance for roads, utilities, and public facilities. Supply-chain disruptions can slow construction projects and limit availability of critical parts for water/wastewater, transportation, and communications systems.
Natural Environment
While EIDs primarily affect human systems, response activities can influence the environment. Increased use of medical disposables and disinfectants elevates medical and solid-waste volumes, requiring proper handling to avoid secondary environmental impacts. Wastewater surveillance—often deployed for EIDs—integrates environmental sampling into public health practice and necessitates careful lab and sampling protocols. Changes in human activity (e.g., reduced travel) may temporarily alter local air quality and traffic-related emissions.
Social Environment
EIDs most strongly affect the social environment. Illness, isolation, and caregiving responsibilities reduce workforce availability, interrupt schooling and childcare, and strain household finances—especially for hourly and small-business workers. Behavioral-health needs rise due to stress, grief, and prolonged uncertainty, while misinformation can erode trust and complicate protective actions. Impacts are disproportionate for older adults, people with chronic conditions, low-income and uninsured residents, and those in congregate or high-exposure settings (schools, long-term care, logistics and retail).
Climate Impacts on EID
Climate does not directly “cause” EIDs, but it can shape risk conditions. Hotter summers and poor air-quality days can drive indoor crowding, increasing transmission opportunities for respiratory pathogens. Shifts in precipitation and temperature can extend vector seasons (ticks, mosquitoes) and alter wildlife–human interfaces that enable zoonotic spillover. Climate stress on infrastructure and households (e.g., heat waves, severe storms) can also complicate access to care and continuity of operations, amplifying the consequences of an outbreak when it coincides with other hazards.
Vulnerability
In Butler County, vulnerability to infectious disease is shaped by factors including population density, age structure, access to healthcare, and mobility patterns. Urban and semi-urban counties with hospitals, congregate settings (e.g. long-term care, prisons, schools), and higher population turnover may face greater exposure and transmission potential. Rural areas may face challenges in accessing care, diagnostics, or public health infrastructure, compounding vulnerability if an outbreak reaches them. Counties with more aging populations or higher prevalence of underlying health conditions (e.g. diabetes, heart disease) may suffer higher morbidity and mortality rates. Gaps in vaccination coverage, health literacy, and public health capacity can amplify risk. Interjurisdictional coordination, surveillance, and rapid response capability are therefore critical to reducing vulnerability across the region.
Butler County’s rural character and lower population density confer some natural dampening of transmission risk, but infrastructure constraints may amplify vulnerability in an outbreak. The county may lack redundancy in
diagnostic laboratories, emergency care, or isolation capacity. Delays in health services or public health response could worsen outcomes, especially for more severe pathogens.
Karst/Sinkholes in Butler County
Description
Karst refers to a type of topography formed in limestone, dolomite, or gypsum by dissolution of these rocks by rain and underground water, and is characterized by closed depressions or sinkholes, and underground drainage. During the formation of karst terrain, water percolating underground enlarges subsurface flow paths by dissolving the rock. As some subsurface flow paths are enlarged over time, water movement in the aquifer changes character from one where ground water flow was initially through small, scattered openings in the rock to one where most flow is concentrated in a few well developed conduits. As the flow paths continue to enlarge, caves may be formed and the ground water table may drop below the level of surface streams. Surface streams may then begin to lose water to the subsurface. As more of the surface water is diverted underground, surface streams and stream valleys become a less conspicuous feature of the land surface, and are replaced by closed basins. Funnels or circular depressions called sinkholes often develop at some places in the low points of these closed basins.
Types of Sinkholes
Solution Sinkholes are formed by the weathering by dissolution of exposed soluble bedrock (limestone, dolomite, marble, and rock salt) at the land surface. Surface water collects in the natural depressions and slowly dissolves a sinkhole.
Collapse Sinkholes form when the surface materials suddenly sink into a subsurface cavity or cave. Cavities form slowly over time as groundwater moves along fractures in soluble bedrock which enlarges them through dissolution. Collapses may occur when the cavity gets sufficiently large and the “roof” becomes too thin to support the weight of any overlying rock or sediment causing the cavity to collapse; or if groundwater levels are lowered causing the overlying sediment to first erode and then collapse into the dewatered cavity.
Subsidence Sinkholes – Similar to solution sinkholes, except the soluble bedrock is covered by a thin layer of soil and/or sediment. Surface water infiltration dissolves cavities where the bedrock is most intensely fractured resulting in the overlying sediment to gradually move downward into the expanding cavity. Sinkhole collapse is the hazard most commonly associated with karst. This hazard occurs in the soil that lies on top of soluble bedrock.
Extent & Past Events
Why Do Sinkholes Collapse?
The Kentucky Geological Survey (KGS) identifies two ways in which sinkholes collapse:
- The roof of a cave becomes too thin to support the weight of the material above it and collapses.
- Limestone bedrock develops a fracture that is enlarged by water dissolving the limestone. As the limestone erodes, the soil above it slowly falls into the developing sinkhole. This type of cover-collapse is typically very slow and occurs over a long period of time. Only in rare instances will limestone bedrock dissolution cause a rapid collapse.
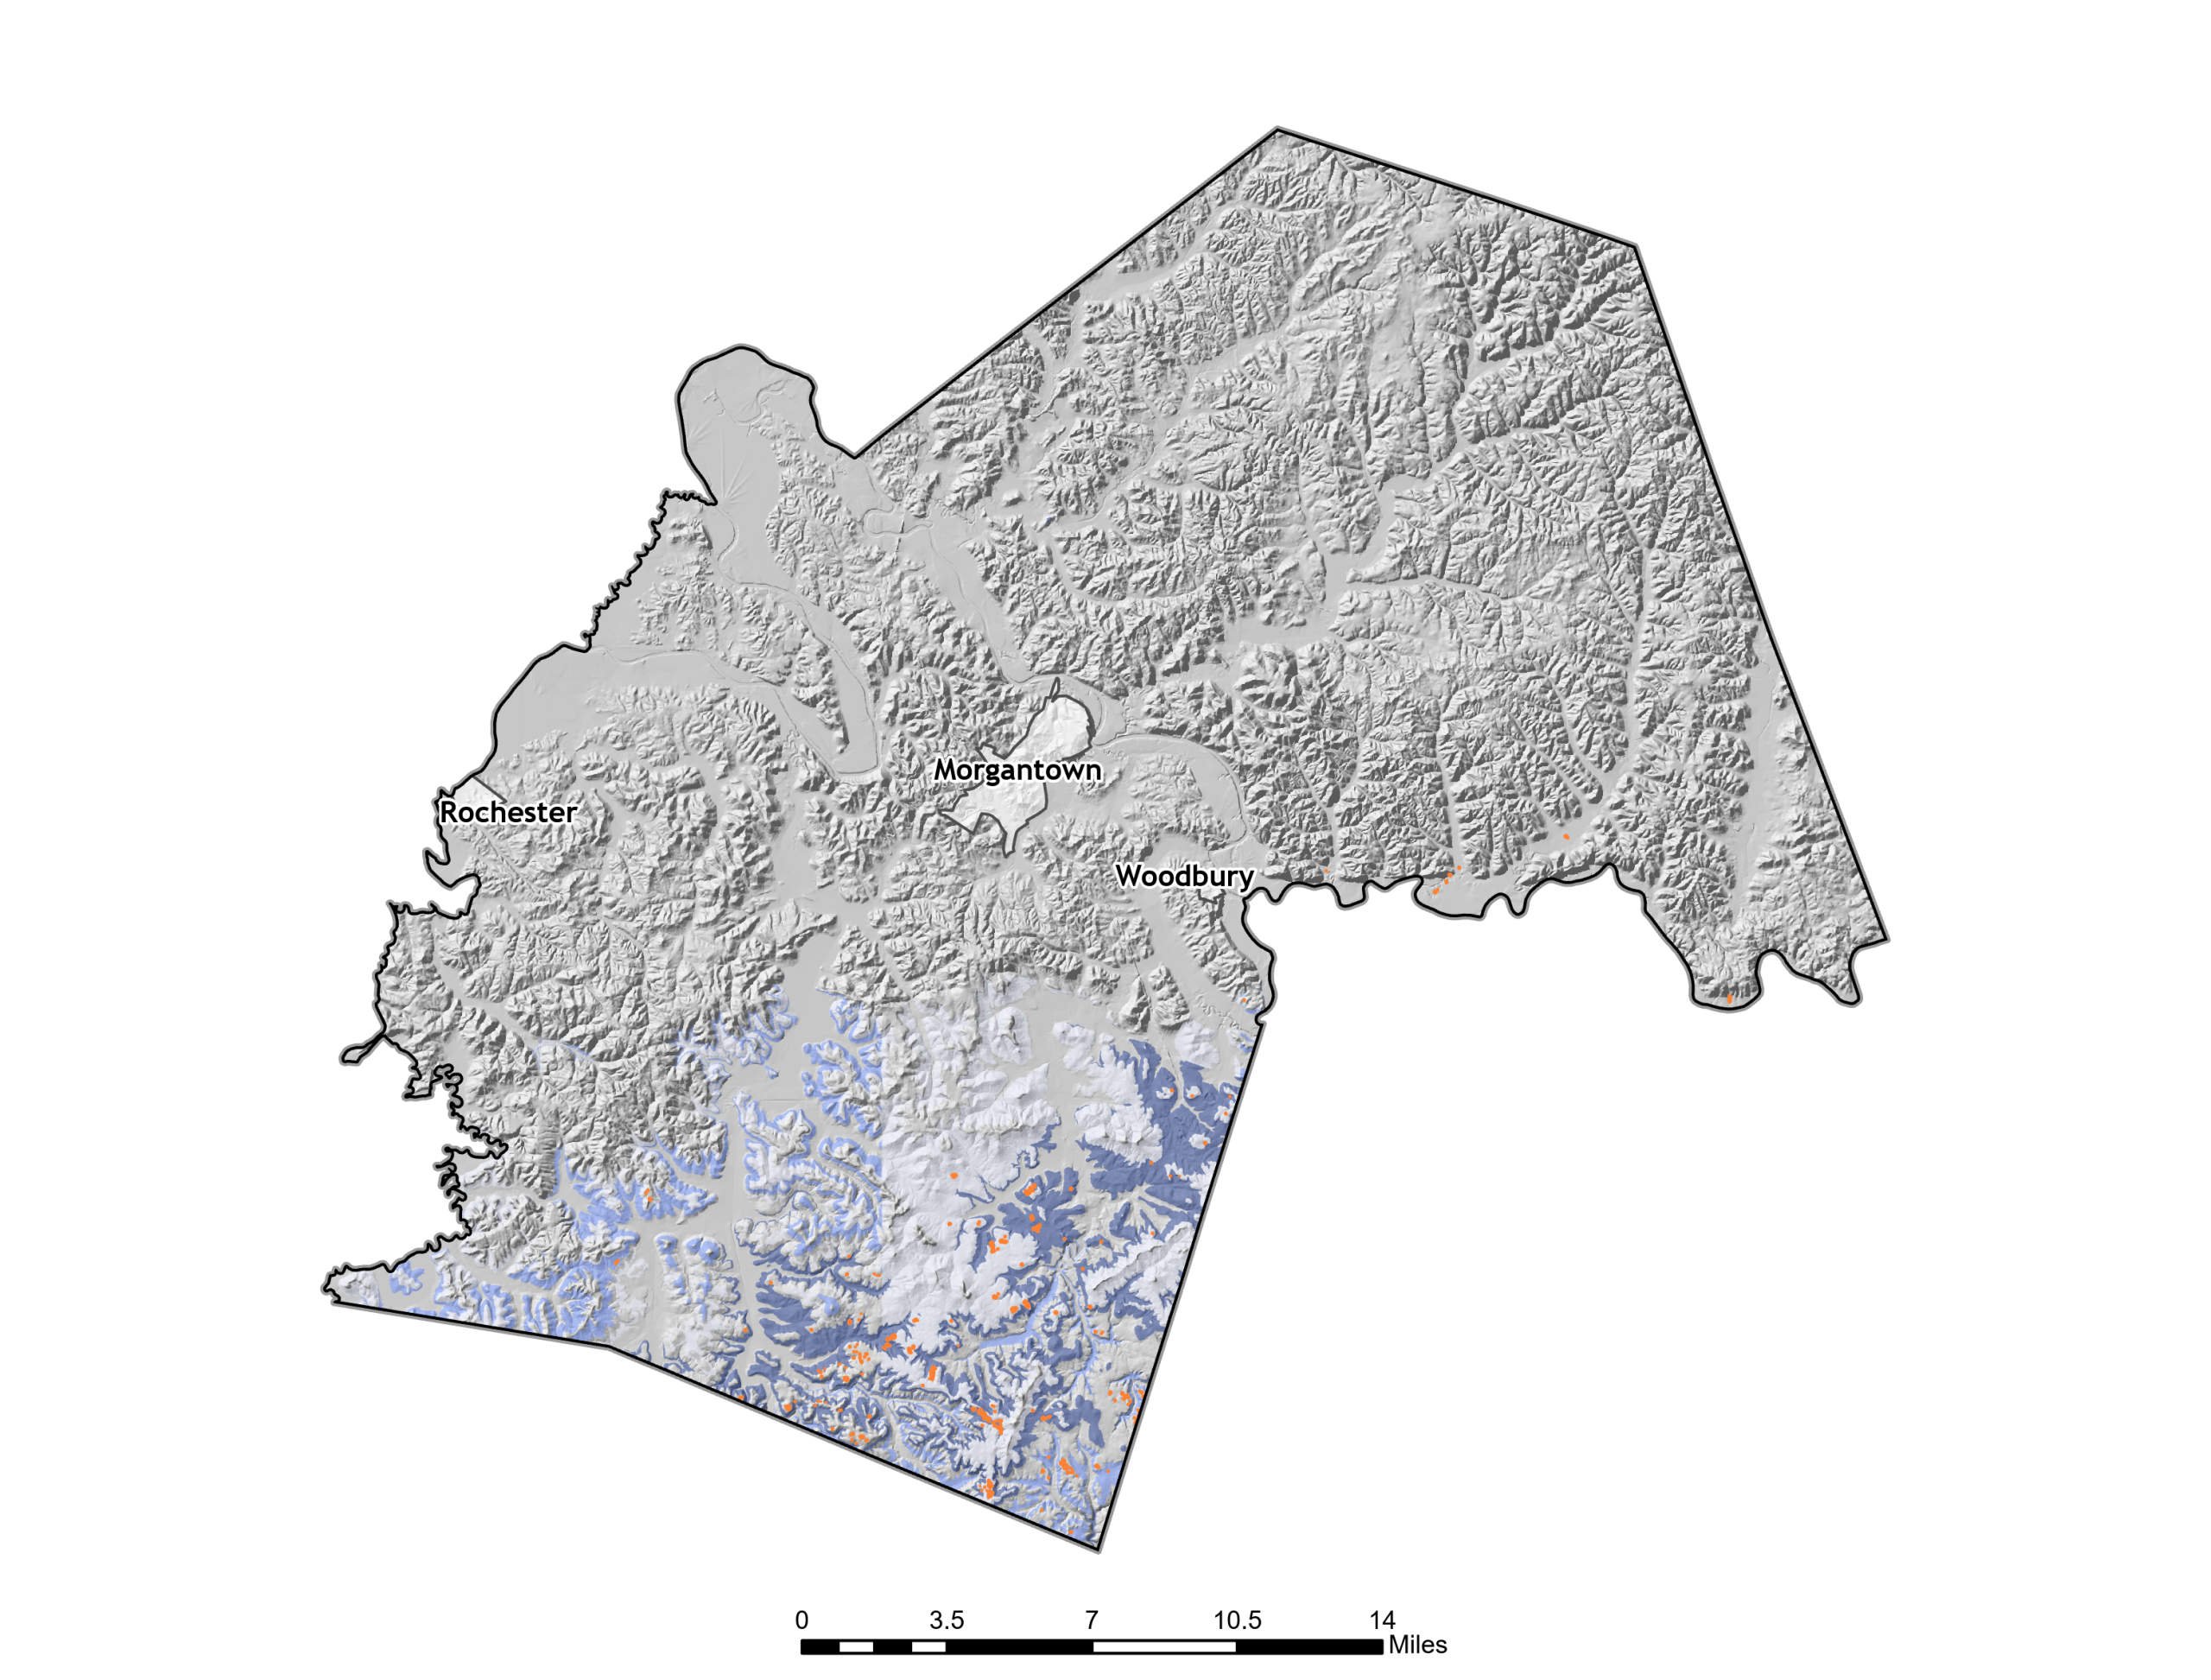

Location
Karst-related hazards happen quickly and without warning. However, scientists have mapped a large portion of the BRADD region to determine where these hazards are most likely to occur. A snapshot of this mapping is located above. to view a fully interactive map and explore sinkholes by jurisdiction, click on the link below.
Probability of Future Events
The likelihood of new sinkhole formation or reactivation of existing depressions is moderate under current conditions and increasing with expanding development, aging stormwater systems, and heavier rainfall patterns. While most collapses are small and isolated, their unpredictability and potential to undermine roads or utilities justify continued monitoring and maintenance of known karst features.
Impact
Built Environment
Damages to human-made structures caused by sinkholes can range from minor to severe. Office buildings, homes, roads, utility lines, and other critical facility or structure located above a sinkhole could be affected. If the sinkhole is large enough, it can affect an entire building or home when it collapses. Minor sinkholes will cause brief damage and are usually fixed with simple excavation techniques.
Drainage water runs into sinkholes during heavy rains and will affect any structures built within the flood plain of a given sinkhole. Present sinkhole vulnerability to flooding can alter the urbanization plans and other forms of expansion and commercialization.
Transportation systems are greatly affected by sinkholes since much of the BRADD’s roadways and highways are constructed over sinkholes. When these sinkholes collapse they not only destroy the road itself but the ground beneath it. Intricate and expensive excavating techniques must be utilized to repair a roadway and its ground foundation affected by a sinkhole.
Because of the vast amount of sinkholes in the BRADD region, there is an extensive groundwater network that supplies public water systems serving many residents. Groundwater essentially originates from rain or other forms of precipitation that soak into the ground and move forward to fill cracks and other openings in soils and rocks. This permeable layer is known as an aquifer. Groundwater is also an abundance natural resource making up 9% of all the freshwater in the world. This water is a direct main source for usable, fresh water for over a million residents in Kentucky, including the Barren River region. For surface streams, groundwater provides as a base flow when it is not raining. Groundwater, especially in a karst environment, is highly susceptible to contamination. Impure rain water, septic tank effluent, agricultural pesticides, and animal waste all contribute to the contamination of groundwater through seepage and runoff. However, contamination problems are aggravated in karst areas by the practice of the disposal of solid and liquid wastes into sinkholes where they may be washed directly into the aquifer.
Natural Environment
The natural environment is very vulnerable to the effects of sinkholes. Carbonic rock such as limestone is eroded away by acidic rain and water runoff. This carves out subterranean passages throughout the underside of the landscape. When the ground level clay or cohesive rock materials cannot support the weight, they cave in and fall into these passages. The result is a karst landscape. Sinkhole collapse greatly damages and alters the natural environment. Groundwater contamination can kill cave aquatic life.
Social Environment
People – Anyone living or working near sinkholes or within the drainage basin of a sinkhole is vulnerable. Karst can lead to radon-related health concerns, sinkhole collapse can lead to loss of life and property, groundwater contamination may lead to build-up of dangerous gases in homes and businesses, and flooding may cause drowning.
Economy – Cost of making repairs to property, repairing roads, preparing special foundations for large buildings, an extending public water lines to replace polluted groundwater.
Climate Change and Sinkholes
There is an expected impact on sinkholes due to climate change. Increasing temperatures will likely affect hydrologic processes, enhance dissolution of limestone, and promote soil failure. It was found in one study that with every increase of 0.2ºF in global temperature, there is a 1-3% increase in the number of sinkholes, thus, there is a high possibility that an increase in sinkholes is due to climate change. With an increase in intense rain events, there could also be an increase in sinkholes opening due to runoff and undermining of soil.
Potential impacts include:
- Damage to roads and property
- Displacement of residents
- Transportation issues (traffic, blocked routes)
- Economic loss due to changes in development patterns or sinkholes/flooding
Working with AT&T’s Climate Resilient Communities Program and the Climate Risk and Resilience (ClimRR) Portal, BRADD identified additional opportunities for hazard mitigation action items associated with climate impacts for Karst Landscapes in the Barren River Region. To view an interactive report of these findings, click here.
Vulnerability
Vulnerability in Butler County is low, primarily affecting rural infrastructure, roadways, and private property in areas of mapped karst density. Development pressure near Morgantown and along major corridors (e.g., US-231, I-165 interchanges) could increase exposure if stormwater and foundation design do not account for subsurface drainage. Regular inspection of drainage ditches, culverts, and known sinkholes, coupled with public education on reporting new collapses, helps reduce hazard impacts. Coordination with KGS, KYTC, and local planning ensures that sinkhole mapping and risk information remain current.
Vulnerability Summary Analysis
Based on KGS’s data there are 170 Topo and LiDAR-identified sinkholes within Butler County. In the unincorporated areas of the county (only county land), there are 170 topo and LiDAR-identified sinkholes.
The majority of Butler County has no present karst potential. However, the southeastern portion of the county has pockets of karst/sinkhole potential ranging from medium to very high.
Due to these factors, Butler County experiences low vulnerability to sinkholes. The risk for Butler County’s cities is analyzed below.
Morgantown has 0 identified sinkholes. Its vulnerability is low.
Rochester has 0 identified sinkholes. Its vulnerability is low.
Woodbury has 0 identified sinkholes. Its vulnerability is low.
Landslides in Butler County
Description
Landslides are the downslope movement of rock, soil, or both under the influence of gravity. Landslides occur when gravity exceeds the strength of earth materials that compose the slope.
What Triggers Landslides?
Often landslides are triggered from a combination of activities including:
- Intense rainfall: Soil and rock material on slopes may have high moisture levels, increasing pore-water pressure, which destabilizes the slope and causes slides. Subsequently, surface-water erosion may also cause landslides.
- Earthquakes: Ground shaking during earthquakes can cause landslides in many different topographic and geologic settings.
- Water-level change: Rapid lowering of groundwater against a slope can trigger landslides, especially along dams, coastlines, reservoirs, and rivers. The pore pressure in soil or rock material may not be able to adjust to a sudden drawdown of water causing slope instability.
- Human activities: Many destabilizing activities may trigger landslides. These include vegetation removal, surface and underground mining, excavation of toe slopes, loading on a slope, and leakage from pipes.
- Geology: Easily weathered rock types and soils, especially on steep slopes, combined with the triggers listed above are susceptible to landslides.
How Do Landslides Move?
Landslide is a general term for a wide variety of down slope movements of earth materials that result in the perceptible downward and outward movement of soil, rock, and vegetation under the influence of gravity. In areas where a landslide is prone to happen, the event itself usually must be triggered by some other phenomena such as an earthquake or heavy rainfall. Slope failures are major natural hazards throughout the world. A slope failure is classified based on how it moves and the type of material being moved.
There are four identified types of major slope failures:
- Slide: A slide is the downward displacement of material along one or more failure surfaces. The material can be soil, rock, etc., and may be broken into a number of pieces or remain a single, intact mass.
- Flow: A flow is similar to a slide in the fact that downward displace of materials occur. However, the distinguishing characteristic is the high water content involved in a flow. The combination of loose soils, rocks, organic matter, air, and water form a mass with the appearance of a viscous fluid.
- Lateral Spread: A lateral spread refers to the displacement of gently sloping ground as a result of pore pressure build-up or liquefaction in a shallow, underlying layer of material. The movement rates are typically very slow but can occur spontaneously.
- Falls: A fall occurs when masses of roc or other material detach and descend down a steep slope or cliff. Falls usually result from an earthquake or common erosion and gravity. The movement rate of a fall is extremely rapid and damage can be critical.
Location, Past Events, & Extent
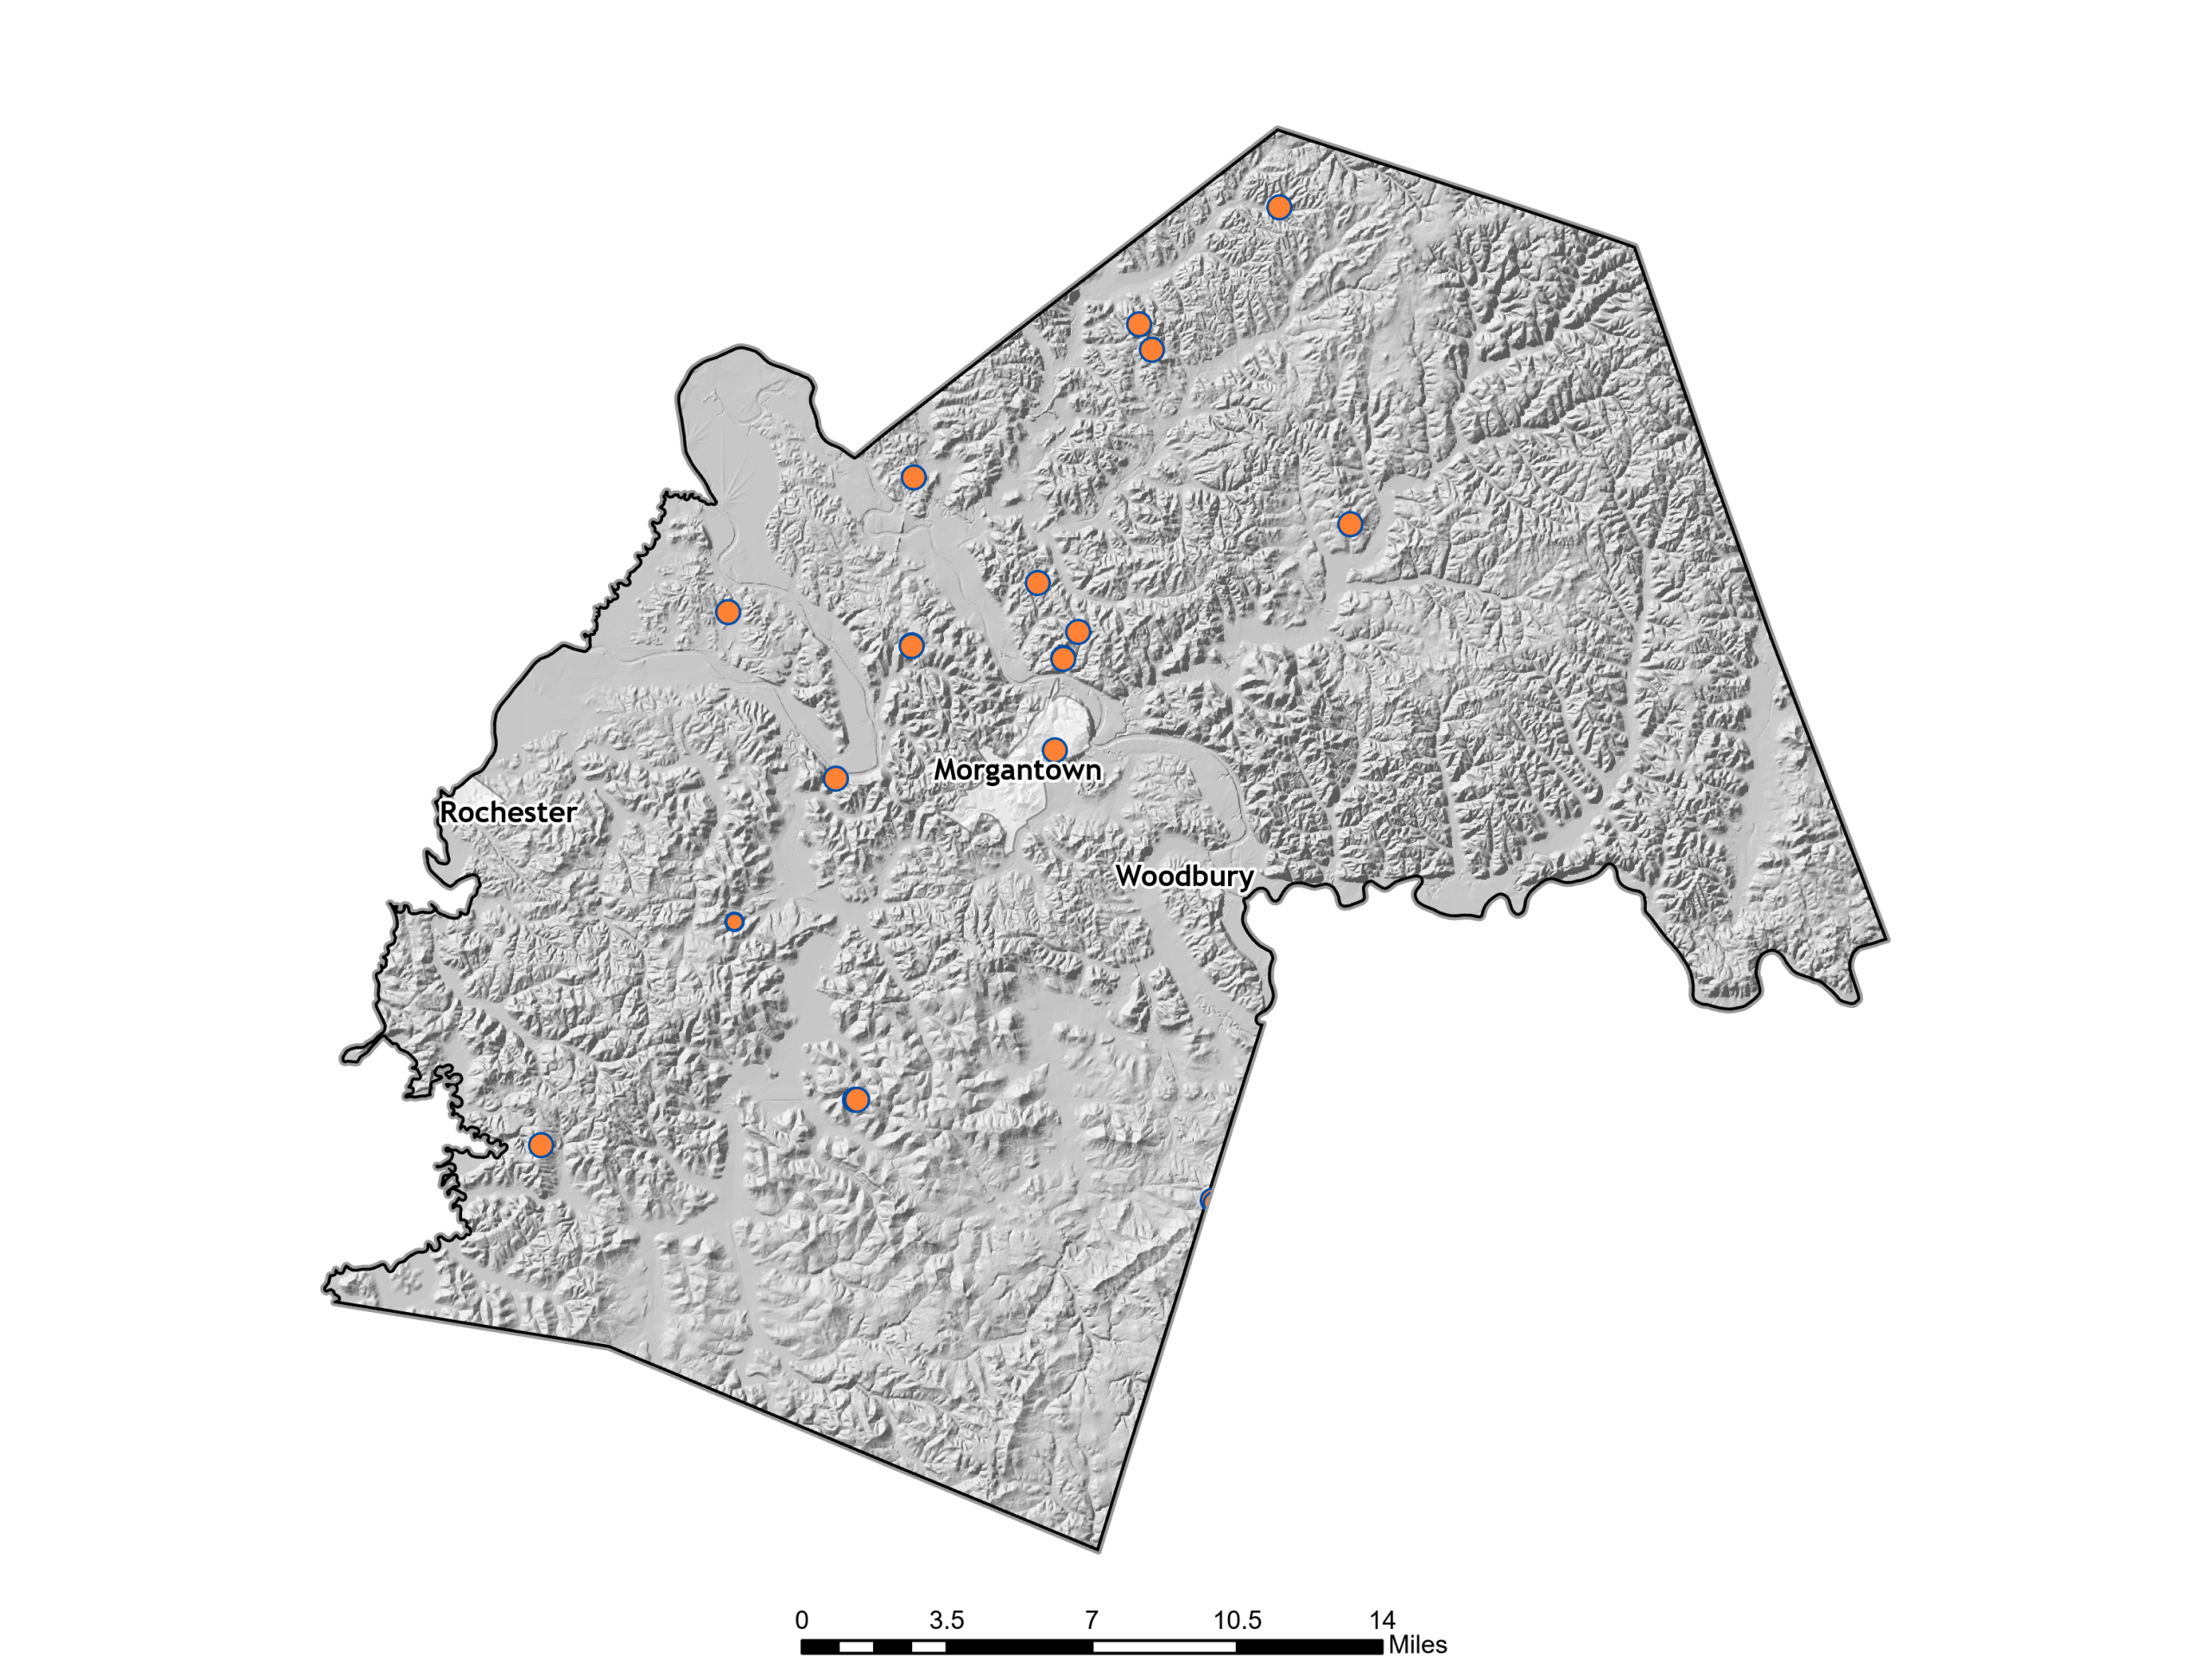

Landslide Susceptibility
During Kentucky’s 2018 Hazard Mitigation Plan update, Kentucky Geological Survey (KGS) developed a landslide susceptibility map for the state in order to show which areas have greater landslide risk due to slope and geology. Using the KGS data, BRADD staff created a landslide susceptibility dashboard for our 10-counties. Click on the button below to access the BRADD Landslide Dashboard.
Probability
In Barren County, the overall probability of landslides is low to moderate and highly localized. Most of the county’s terrain is gently rolling, but steeper stream valleys, road cuts, fill slopes, and embankments can become unstable—especially after prolonged or intense rainfall, rapid freeze–thaw cycles, or construction that changes drainage or slope geometry. Susceptibility increases on clay-rich soils and along incised creek corridors where banks are undercut. As with much of south-central Kentucky, landslide occurrence tends to be episodic: quiet for long periods, then clustered following major storms or extended wet seasons.
Butler County: 18 events/30 years = .6 landslide events per year or 60% chance of a landslide event happening annually.
During Kentucky’s 2018 Hazard Mitigation Plan update, Kentucky Geological Survey (KGS) developed a landslide susceptibility map for the state in order to show which areas have greater landslide risk due to slope and geology. Using the KGS data, BRADD staff created a landslide susceptibility dashboard for our 10-counties. Click on the button below to access the BRADD Landslide Dashboard.
Impact
Built Environment
Human-made structures are directly affected by landslides. Any structures such as buildings, roads, bridges, street lighting, and power lines can be completely destroyed if in the direct life of the landslide.
Any roads or other transportation systems that are in the path of a landslide will be directly affected. Roads can either be covered by the debris or wiped completely away. Power lines and telecommunication networks would also be directly affected. Along with roads, telephone poles and towers can be damaged and ruined during the event of a landslide.
Natural Environment
A landslide, itself, involves natural materials. The drastic displacement of earth, trees, and debris can cause persistent problems such as continued erosion. Landslides can carry contaminated materials into streams and other water bodies, directly affect wildlife by destroying wildlife habitats such as wooded areas, streams, and ponds. This can affect the ecosystem and all living things within it.
Social Environment
People
The vulnerability of a landslide do not affect one section of the population more than another. Anyone living in an area at high risk of a landslide will be affected. Landslides can occur spontaneously and randomly.
Economy
Economic costs associated with landslides are due to replacement costs for any property damaged. If transportation and telecommunication networks are damaged or destroyed, it may lead to business closures for a brief time.
Climate Change and Sinkholes
There is limited evidence connecting climate change to an increase in landslides; however, it is theorized that more intense rainfall, rain-on-snow events, mean warming, permafrost thaw, glacier retreat, and coastal erosion can lead to rockface instability and decreased slope (IPCC 2022). There has been an increase in landslides in certain areas of the world and it is expected that there will be an increase in frequency in northwestern North America. Studies make these projections based on increasing rainfall intensity and frequency, so it is possible that the BRADD region may see minor impacts from these in the form of slumps and low-grade slope failure. Kentucky’s landslides mostly occur in Eastern Kentucky, so the BRADD region should not be significantly impacted.
- Potential impacts include:
- Infrastructure damage
- Ecosystem damage
- Loss of life
- Economic loss
Vulnerability
Vulnerability concentrates where people and infrastructure intersect steep or engineered slopes: hillside homes, driveways, and outbuildings; roads and bridges on or beneath cut-and-fill sections; and utilities (water, sewer, gas, fiber) buried in or crossing unstable ground. Even small slope failures can close rural roads, isolate residences, damage culverts, and disrupt emergency response. Natural systems are affected through streambank failures, sedimentation, and habitat disturbance. Social impacts fall hardest on households with limited resources for slope stabilization and on areas with few alternate routes.
Vulnerability Summary Analysis
Since 1991, KGS has recorded 18 landslides in Butler County. This averages to .6 landslide events per year.
Because of these factors, Butler County experiences high vulnerability to landslide events. The risk for Butler County’s cities is analyzed below.
The City of Morgantown has had three historic occurrences of landslide events. Its vulnerability is medium.
The City of Rochester has had no historic occurrences of landslide events. Its vulnerability is low.
The City of Woodbury has had no historic occurrences of landslide events. Its vulnerability is low.
Pandemics in Butler County
What is a Pandemic?
The World Health Organization (WHO) describes a pandemic as the “worldwide spread of a new disease”. Often there is little to no immunity within a community to this new or re-emergent disease, so transmission and contraction is significant. While a general definition of ‘pandemic’ exists, the term is often misapplied. However, there are characteristics of disease and disease spread that allow public health practitioners to identify a pandemic and begin responding.
Characteristics of Pandemics
David Morens, Gregory Folkers, and Anthony Fauci published a paper in a 2009 volume of The Journal of Infectious Diseases describing the eight characteristics of a pandemic. They note that pandemic is often used by the media to describe disease spread which does not rise to the level of being classified by scientists and public health officials as pandemic. These are the eight characteristics that are common in diseases that are officially classified as pandemics:
1. Wide Geographic Extension
Pandemics impact a wide geographic area, often being classified as transregional, interregional, or global.
2. Disease Movement
The spread of a pandemic disease can be traced from place to place.
3. High Attack Rates & Explosiveness
Refers to the number of cases of a particular illness reported within a short time frame. Diseases with slow rates of transmission are rarely classified as a pandemic, as was seen in the 1999 spread of the West Nile virus from the Middle East to both Russia and the Western Hemisphere.
4. Minimal Population Immunity
While pandemics have occurred in partly immune populations, limited population immunity has created ideal conditions for pandemic disease to develop and spread.
5. Novelty
The term ‘pandemic’ is often applied to new diseases, or new variants of known diseases. However, this does not preclude repeatedly
6. Infectiousness
Pandemic diseases generally have a high level of infectiousness. While the term has been applied to non-infectious health issues, such as cigarette smoking, this term is often used in less scientific settings.
7. Contagiousness
Most diseases classified as ‘pandemic’ are transferred from person-to-person.
8. Severity
Pandemic typically describes diseases that are severe or fatal, such as SARS, HIV/AIDS, and the Black Death. Measuring Magnitude
In the event of a pandemic, the WHO and the U.S. Center for Disease Control and Prevention (CDC) direct response efforts. Depending on the severity of the outbreak, local or national public health agencies may also respond. The World Health Organization breaks pandemic alerting into five phases:
- Phase 1: No viruses circulating among animals have been reported to cause infections in humans
- Phase 2: Animal influenza virus circulating among domesticated or wild animals is known to have caused infection in humans, and is therefore considered a potential pandemic threat.
- Phase 3: An animal or human-animal influenza reassortant virus has caused sporadic cases or small clusters of disease in people, but has not resulted in human-to-human transmission sufficient to sustain community-level outbreaks. Limited human-to-human transmission may occur under some circumstances
- Phase 4: Characterized by verified human-to-human transmission of an animal or human-animal influenza reassortant virus able to cause “community-level outbreaks.” The ability to cause sustained disease outbreaks in a community marks a significant upwards shift in the risk for a pandemic.
- Phase 5: Characterized by human-to-human spread of the virus into at least two countries in one WHO region. While most countries will not be affected at this stage, the declaration of Phase 5 is a strong signal that a pandemic is imminent and that the time to finalize the organization, communication, and implementation of the planned mitigation measures is short.
Pandemics in the Last Century
In addition to the current COVID-19 Pandemic, the Kentucky Cabinet for Health and Family Service explains that there have been four other pandemics in United States in the last 100 years: the 1918-1919 Spanish Flu, the 1956-1958 Asian Flu, the 1968-1969 Hong Kong Flu, and the 2009 Novel H1N1. Combined, these four pandemics have claimed thousands of lives in the Commonwealth, hundreds of thousands in the United States, and millions worldwide.
Spanish Influenza 1918-1919: Historical examples of pandemic demonstrate that while a pandemic may be devastating to a community from a life safety and economic standpoint, the threat was often downplayed and ignored. The 1918 Spanish Influenza pandemic was initially disregarded as having a significant impact because influenza was thought of as a minor illness that incapacitated the sick for a relatively short period of time before they eventually recovered. However, as the Spanish Influenza rose to pandemic level, it redefined the public’s perception of the virus. A historian at the time noted that at a military encampment in southern Ohio, soldiers would arrive healthy and within twenty-four hours would be dead from the flu. The virus spread globally along trade routes and shipping lines. Residents of North American, Europe, Africa, Asia, Brazil, and the South Pacific were particularly affected by the illness, which in-total infected 1/5 of the global population. In contrast to the majority of flu strains, the Spanish Influenza primarily affected young, healthy adults between the ages of 20 and 40. The mortality rate was 2.5%, an astounding figure given that flu outbreaks typically have a rate of 0.1%. By the end of the pandemic, the virus had claimed 20 million lives worldwide and 675,000 in the United States.
Asian Flu 1956-1958: The New York Times first broke the news of the Asian Flu in 1957 when they published a story of a flu virus that had infected 250,000 in Hong Kong. Months after this story was published, the disease had spread to the United States. Unlike Spanish Influenza, the Asian Flu was most commonly reported in the vulnerable populations, such as the elderly and individuals with heart and lung conditions. People with rheumatic heart disease and women in their third trimester of pregnancy were uniquely impacted. Infection for this pandemic came in two parts—the first in the late summer of 1957 and the second in the winter of 1958. The death toll for the Asian Flu widely varies, with sources reporting between 1 and 4 million deaths worldwide and approximately 69,800 in the United States.
Hong Kong Flu 1968-1969: The Hong Kong Flu is the mildest of all pandemics of the 20th century, a fact that is often explained by its similarity to the Asian Flu which increased immunity to the 1968 strain and the fact that it hit the United States in late December when most students were on break, reducing opportunities for spread. As with the Asian Flu, the vulnerable populations, particularly the elderly, were most at risk. By the end of the pandemic in 1969, it had claimed 33,800 lives in the US.
H1N1 2009-2010: This pandemic first appeared in the United States in the spring of 2009. By June, H1N1 had infected 18,000 people in the US. The virus primarily affected the populations most typically affected by the flu: children and infants, pregnant women, the elderly, and individuals with prior-existing health conditions. Due to advancements in medical research and technology, the overall impact of the pandemic was curbed. A vaccine was introduced in the fall of 2009. Approximately 80 million people were vaccinated worldwide. By the time the pandemic was declared over in the spring of 2010, between 43-89 million people had been infected and between 8,870 and 18,300 people had died.
COVID-19 2020-2023: The most recent pandemic first appeared in the United States in the spring of 2020. By July 2020, COVID-19 had infected over 200,000 people worldwide. The virus initially primarily affected the elderly, and individuals with prior-existing health conditions, however as spread increased so did the populations at-risk. A vaccine was approved for use against the virus in December of 2020, and in May of 2023 the World Health Organization declared an end to the public health emergency of international concern.
Probability
The probability of another pandemic is moderate to high due to global mobility, zoonotic spillover risk, and pathogen evolution, even as surveillance and vaccination moderate some risk. For Butler County, this translates to ongoing planning assumptions and readiness for periodic surges.
Impact
Built Environment
Infrastructure could be impacted due to lack of repair and upkeep if pandemic is extensive and lengthy; Utility lines and repairs would take longer to repair due to manpower lost.
Natural Environment
Potential increased loss of agricultural assets (crop & livestock) due to loss of manpower to harvest crop; fewer livestock and crop markets due to restriction of crowds which prevent spread of pandemic disease;
Social Environment
People
Farmers-pandemic could affect crop production & yield since they could not seed or harvest; General populace -would be impacted due to both physical and psychological impacts of disease; Possible school closures would aid in disrupting spread of disease; Vulnerable populations may experience more impacts due to synergistic effects of pandemic symptomology. Additionally, the county could expirence increased emergency clinical care visits, more hospitalization (upwards 1-4% symptomatic patients will require hospitalization) leading to severe and overwhelming impacts on healthcare and public health system; workforce absences leading to minimal patient care
Economy
Pandemic can cause business slowdown or even recession; decreased food and merchandise shipped throughout area would increase cost; loss of buyers and sellers due to potential risk of contagion. Increased staff absences (upwards 50% workforce may require time off over entire period of pandemic).
Climate Change and Pandemics
The 2016 Global Risk Report published by the World Economic Forum has proposed that climate change could be a causal factor in future pandemics. This finding is further explored in a 2016 report produced by Johns Hopkins University’s School of Advanced International Studies, Pandemics in a Changing Climate – Evolving Risk & Global Response. The report explains that vector ecology indicates the potential for climate change to create the conditions for future pandemics. Changes in temperature, precipitation, and pH levels due to climate change will impact the quantity and quality of ecological services, such as food, water, and soil. Ecosystem shifts can impact the migratory patterns, habitats, population, and survivability of certain animal and insect populations. Such changes may increase human-animal or human-insect contact, increasing the likelihood of transmission. For example, as hot summer months extend tick and mosquito populations, both culprits in transmission of epidemic-causing viruses, can survive longer and have more opportunities to infect humans. Climate change may have more direct impacts on humans by making certain populations, particularly in developing countries, more susceptible to illness by creating food and water security crises.
Vulnerability
Butler County’s vulnerability is countywide and driven by: (1) population exposure in schools, workplaces, and congregate settings; (2) health-system capacity (surge staffing, ICU beds, supply chains); (3) critical-infrastructure staffing (utilities, EMS); and (4) social factors (older adults, chronic illness, low-income or uninsured residents). Regional COVID-19 experience—hospital surges in nearby Bowling Green/Glasgow and countywide school disruptions—shows that even if local case counts ebb and flow, consequences touch every sector.
Vulnerability Summary Analysis
Butler County’s predominantly rural character affords some buffer, but it maintains vulnerability due to limited healthcare infrastructure and lower redundancy. An influx of cases beyond local capacity may require transfer
of patients and support from neighboring counties. Delay in testing or resource delivery could degrade outcomes.
Severe Storms in Butler County
Description
Severe storms are among the most frequent hazards in Butler County, typically arising from fast-moving thunderstorms that produce damaging straight-line winds, large hail, intense lightning, and periods of heavy rain. The National Weather Service defines a severe thunderstorm as one that generates hail at least ¾ inch in diameter, wind gusts of 50 knots (57.5 mph) or higher, and/or a tornado (tornadoes are profiled separately). Exposure is countywide, with higher potential for property and infrastructure damage in and around Morgantown, Rochester, Woodbury, as well as along major transportation corridors and open agricultural areas. Common impacts include downed trees and power lines, roof and vehicle damage, crop losses, and localized flooding at low-water crossings and culverts—making severe storms a consistent planning priority for Butler County.
Extent, & Past Events & Location
Location: Severe storms are treated as a region-wide, non-spatial hazard; no jurisdiction is inherently more likely to be struck, though more built-up places see greater damages. For Allen, that means exposure countywide, with higher potential property impacts in and around Scottsville.
Extent: The profile evaluates hail, wind, and lightning (tornadoes are handled separately). Severe thunderstorms are defined by hail ≥ ¾”, wind gusts ≥ 50 knots (57.5 mph), or a tornado. Straight-line winds in extreme cases can exceed 100 mph.
Past events / occurrence: Allen County has recorded 105 severe storm events over 21 years (≈ 5 events annually).
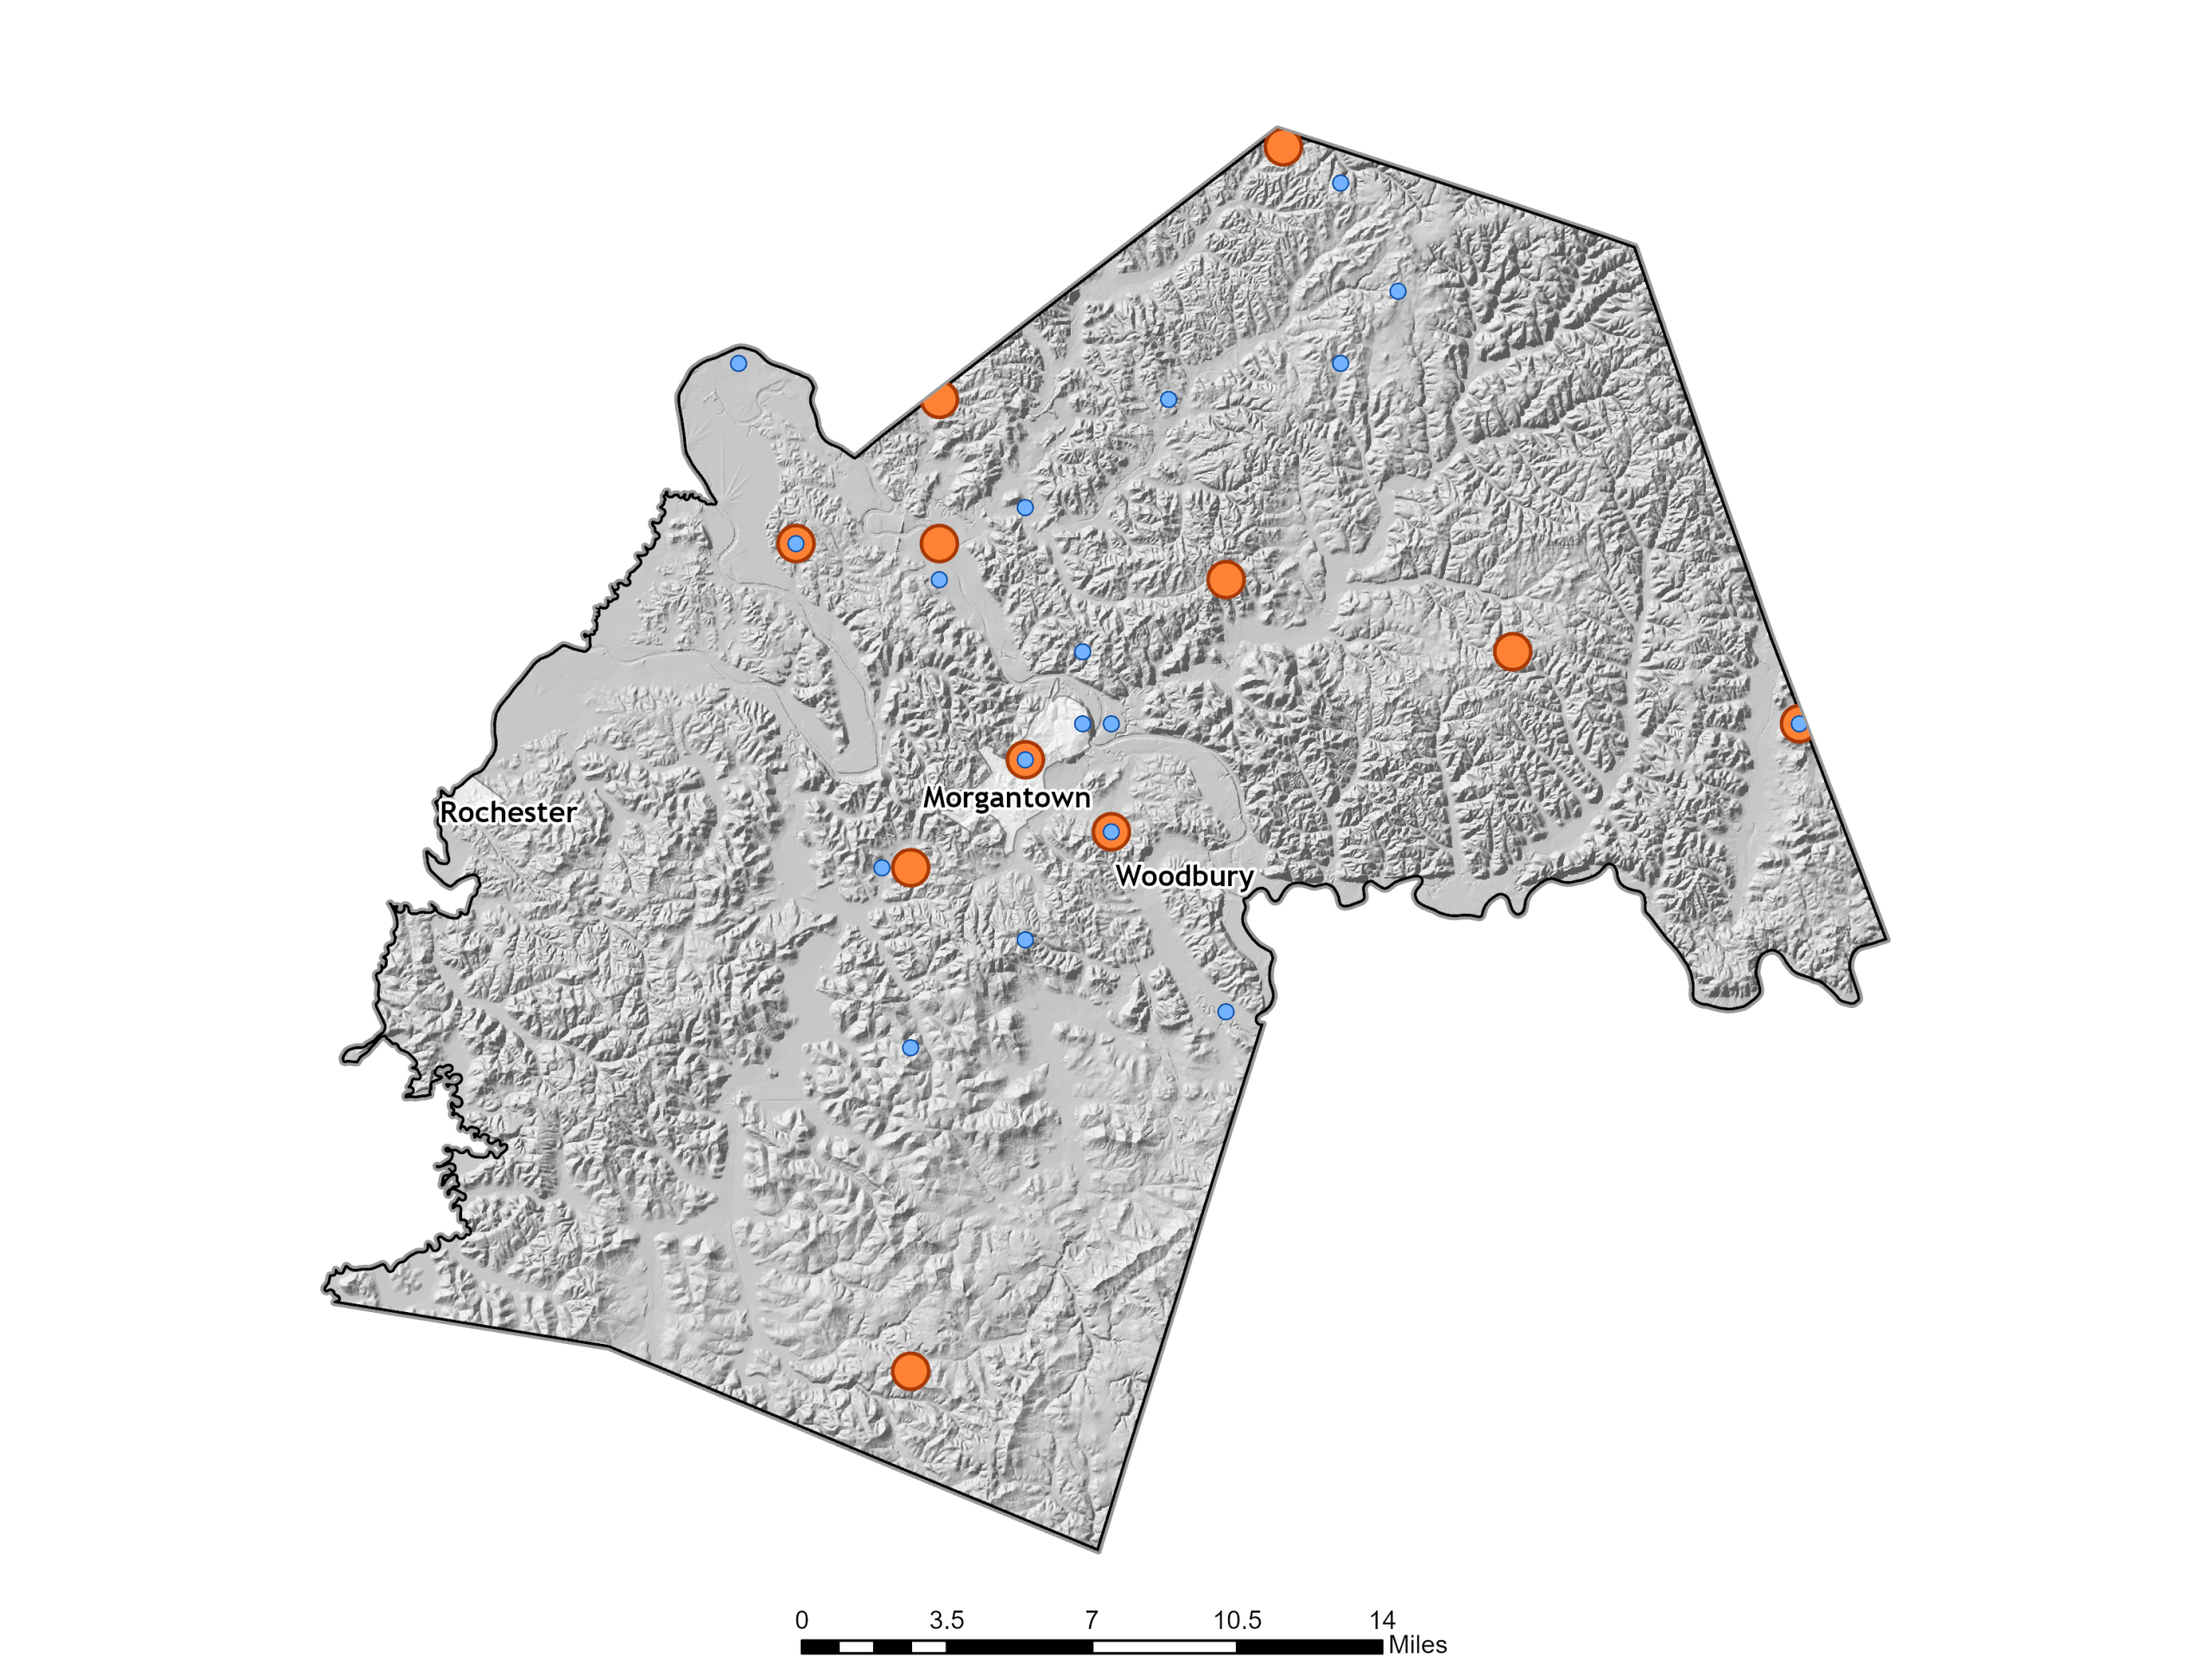

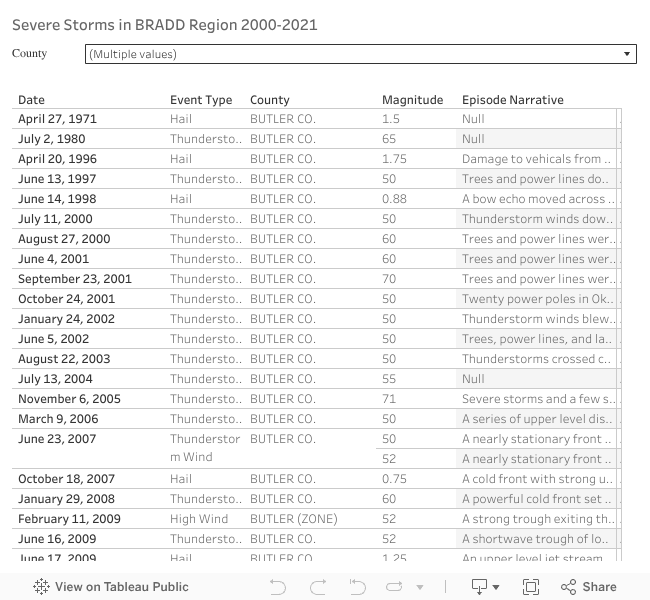
Probability
The BRADD region’s probability of severe storms is rated High based on annual frequency; this regional rating applies to Barren County as well.
- Butler County: 81 severe storm events/21 years = 3.85 wind events annually
Impact
Built Environment
Vehicles, roofs, windows, utilities, roads, and culverts are vulnerable; straight-line winds can down trees/power lines, causing outages from hours to weeks.
Natural Environment
Increased stormwater runoff, localized flooding, tree loss, and impacts to fish/wildlife; crop and livestock damage are common consequences.
Social Environment
Outdoor workers and people without timely warnings (boaters, campers, farmers, construction crews) are especially susceptible; damages can trigger brief business closures where transport/telecom are affected.
Climate Change and Sinkholes
Research indicates climate change is increasing the number of days with sufficient CAPE and vertical wind shear to produce severe storms (hail, damaging wind, and tornadoes), implying more frequent environments favorable to severe weather in the region.
Vulnerability
Butler County has experienced 81 severe storm events over 21 years (~3.85 per year) and, because of these factors, Butler County—and its cities of Morgantown, Rochester, and Woodbury—experience high vulnerability to severe storms.
Vulnerability Summary Analysis
Butler County has experienced 81 severe storm events/21 years = 3.85 events annually.
Because of these factors, Butler County experiences high vulnerability to severe storms. Morgantown, Rochester, and Woodbury reflect Butler County’s overall history of severe storms, and therefore experience high vulnerability as well.
Terrorism in Butler County
Description
Terrorism involves the unlawful use or threatened use of violence to coerce or intimidate governments or societies for political, religious, or ideological goals, using tactics that range from conventional explosives and arson to cyberattacks and agro-terrorism (e.g., contamination of food or livestock).
Specific Observations & Broader Challenges with Terrorism Risk
Because terrorism is intentional and adversarial, traditional frequency-based risk assessments are not sufficient for evaluating potential impacts. Unlike natural hazards, terrorism cannot be forecasted or modeled using historical trends alone. Effective assessment must incorporate intelligence inputs, threat actor capabilities, and scenario planning to understand possible modes of attack and associated vulnerabilities.
At present, there is limited differentiation between types of terrorism that may affect the region. Distinguishing between domestic and international threats, as well as between physical, cyber, or hybrid forms of terrorism, can help clarify risk pathways and improve mitigation strategies. The region’s profile would also benefit from identifying and assessing critical infrastructure and “soft targets” that may be more susceptible to intentional acts, such as public gathering venues, utilities, schools, and government facilities.
Probability
Because terrorism is intentional and adversarial, you cannot rely solely on historical frequency to derive probability. Many risk models for terrorism must incorporate intelligence assessments, threat actor capabilities, and scenario planning.
While the page references terrorism conceptually, it does not currently include coordination protocols with law enforcement, fusion centers, or homeland security partners that monitor and share threat intelligence. Strengthening interagency coordination—particularly with local emergency management, police, and state agencies—would provide a more credible understanding of regional exposure and response capability.
Cascading and secondary effects of terrorism events, such as public panic, misinformation, economic disruption, and strain on emergency and health systems, are also important considerations. The social and psychological impacts of terrorism can be significant even when physical damage is limited, underscoring the need to plan for behavioral health support and long-term community recovery.
Additionally, the region’s profile does not currently evaluate local preparedness measures such as continuity of operations plans (COOP), security assessments, or mass-casualty response capacity, which are key indicators of resilience. Future updates should also consider emerging risks, such as cyber-physical attacks on utilities and critical networks, and how these may intersect with traditional forms of terrorism.
Finally, it is important to acknowledge both the limitations and sensitivities of terrorism-related data. Some information—such as specific target locations or threat intelligence—cannot be publicly shared due to security concerns. Nonetheless, transparency in describing the general methods, assumptions, and partnerships used to assess terrorism risk would enhance credibility while maintaining confidentiality.
Impact
Built Environment
Terrorism can destroy or damage buildings and critical lifelines (power, water/wastewater, transportation, and communications), with impacts dictated by the attack method and proximity to critical nodes.
Natural Environment
Acts such as agro-terrorism or hazardous-materials release can contaminate soil, water, or wildlife habitat, and BRADD explicitly notes potential destruction of natural resources under certain attack types.
Social Environment
Intentional acts are designed to cause casualties, widespread fear, and economic disruption; BRADD highlights life-safety risks, psychological effects, and local economic shocks due to reduced participation and interrupted operations.
Climate Change and Sinkholes
Climate stressors (e.g., pressures on marginalized populations, aging infrastructure, and periods of civil unrest) may elevate susceptibility to terrorism-related activities, including threats to infrastructure, property, and cyber/economic systems, even though overall climate-driven terrorism risk for the region remains low.
Vulnerability
Butler County’s vulnerability concentrates where people and critical functions intersect—government and school campuses, utilities, healthcare sites, congregate venues, and commercial hubs—along with cyber-dependent operations. For planning purposes, Butler County should assume countywide exposure with higher consequence potential at critical-infrastructure and high-occupancy sites.
Vulnerability Summary Analysis
Butler County’s vulnerability to terrorism is minimal due to its predominantly rural character and low population density. The City of Morgantown includes essential services and government offices that could experience
localized disruption in an intentional incident. The county’s dispersed population and limited critical infrastructure reduce potential large-scale impacts; however, reliance on regional partners for specialized response
capabilities underscores the need for coordinated communication and preparedness planning.
Tornadoes in Butler County
Description
A tornado is a violently rotating column of air extending from a thunderstorm to the ground, typically visible as a funnel cloud and accompanied by a debris cloud near the surface. Severity is classified with the Enhanced Fujita (EF) Scale, which ties estimated wind speeds to observed damage—from EF-0 (65–85 mph; light damage) to EF-5 (>200 mph; extreme destruction).
Extent
Tornado severity in Butler County can range from brief, weak EF-0/EF-1 touchdowns to rare, high-end EF-3+ events capable of destroying well-built structures; the EF categories and related wind speeds set the bounds for plausible damage.
Past Events & Location
From 2000–2025, Barren County experienced 4 tornadoes (≈ 16% chance of at least one tornado in a given year). Since 1950, tornadoes that touched down in the county have caused 1 injury and 1 death. Regional context includes the December 10–11, 2021 outbreak, with multiple long-track and high-end events affecting neighboring counties.
Tornado exposure is countywide and non-spatial at planning scale; consequences concentrate where people and assets are located (e.g., Scottsville, major corridors, and higher-occupancy or vulnerable housing areas such as mobile homes).
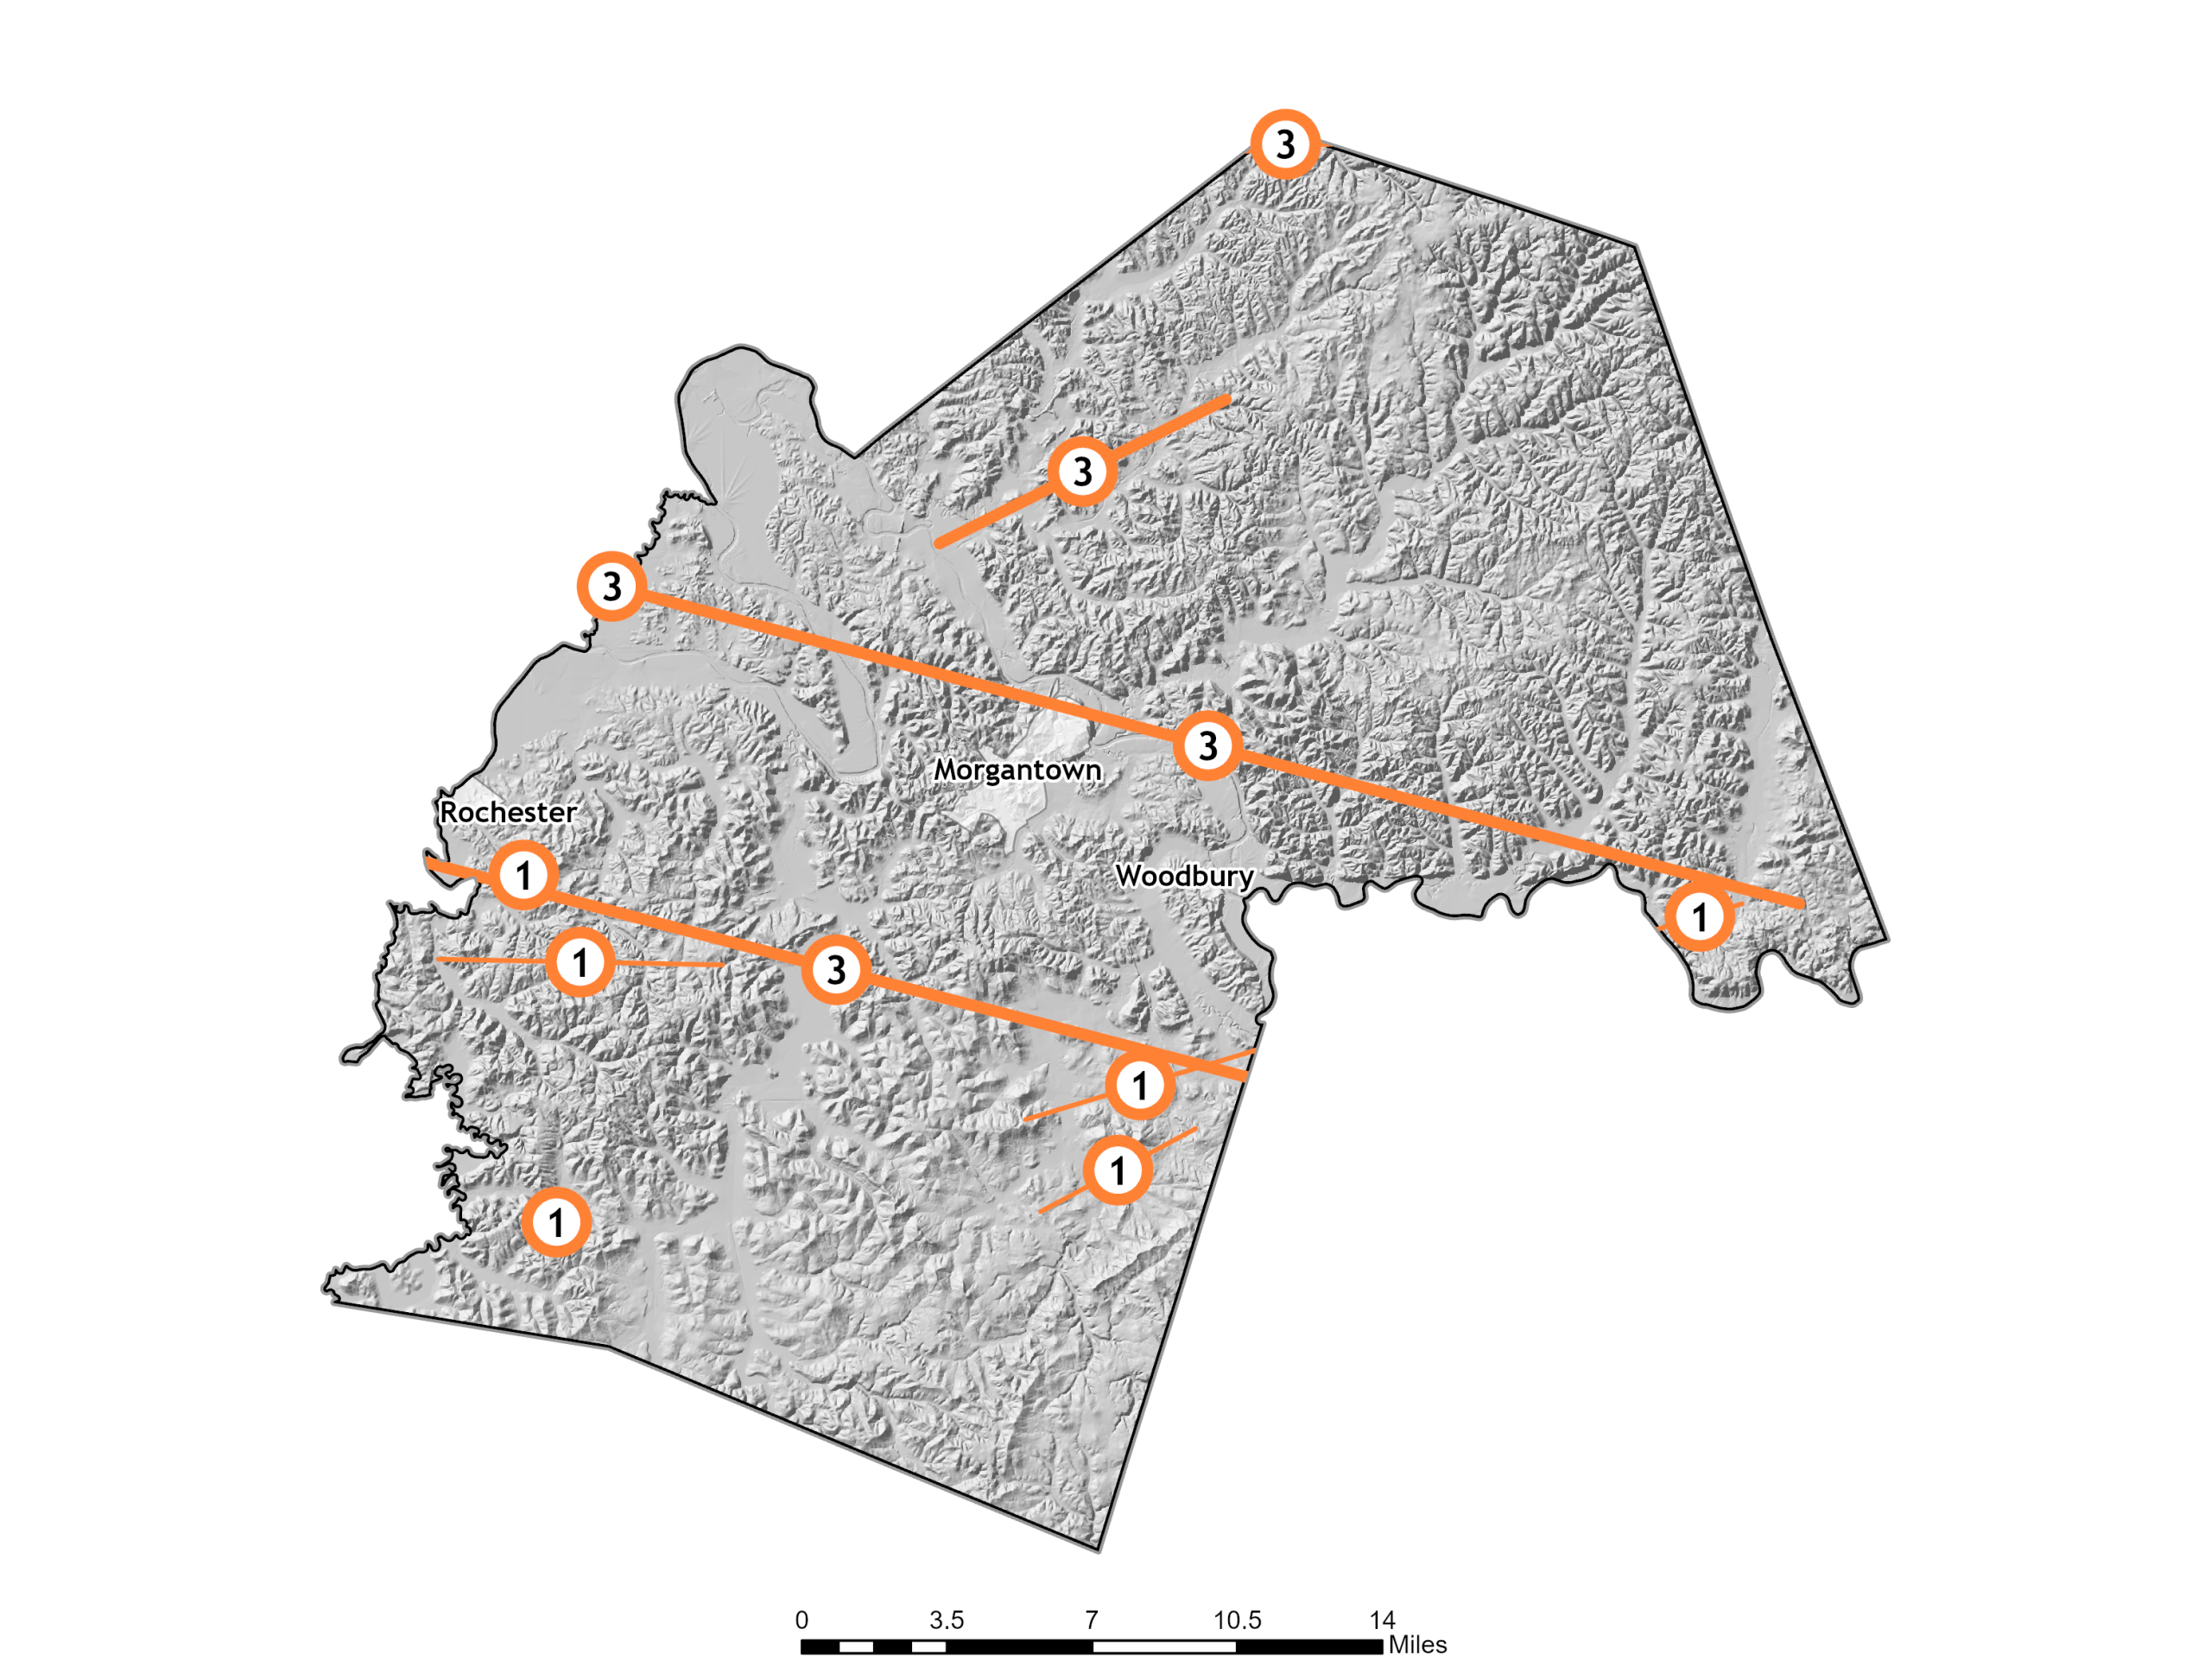

Probability
BRADD rates overall regional probability for tornadoes as high, based on historical frequency, wind-zone classification, and FEMA definitions. Butler County’s recent history (4 events/21 years) supports an ongoing, recurring likelihood at the county scale.
Impact
Built Environment
Tornadoes can damage or destroy homes and businesses, topple transmission and distribution lines, block roads and bridges with debris, and interrupt power, communications, and water/wastewater services.
Natural Environment
Tornadoes can fell trees, damage crops and farm structures, degrade habitats, and increase fire risk where dead or downed timber is not removed.
Social Environment
Tornadoes can cause deaths and injuries, trigger temporary but significant economic disruption, and reduce local revenue and productivity during recovery.
Climate Change and Sinkholes
While attribution is complex at tornado scale, research indicates fewer “one-tornado” days and more multi-tornado cluster days, linked to increases in days with high CAPE and sufficient vertical wind shear; this implies more days conducive to severe storms—a planning consideration for warning, sheltering, and surge response.
Vulnerability
Vulnerability in Butler County is moderate to high, reflecting its rural housing stock, presence of manufactured homes, and reliance on overhead utilities. Critical vulnerabilities include mobile home communities, schools and public facilities without FEMA P-361 compliant safe rooms, and inconsistent indoor warning coverage in some rural areas. Priorities include constructing or identifying community safe rooms, expanding NOAA Weather Radio and Wireless Emergency Alert (WEA) coverage, and promoting public education on sheltering and warning response. Coordination with utility providers to harden grid segments and improve vegetation management also helps reduce secondary impacts from wind damage.
Vulnerability Summary Analysis
Between 2000 and 2021, Butler County has experienced 4 tornadoes/21years =19% chance of a tornado happening in a given year.
Since 1950, tornadoes that touched down in Butler County have caused 1 injury and 1 death.
Butler County contains one census tract wherein at least 25% of all housing units are mobile homes.
Because of these factors, Butler County experiences moderate vulnerability to tornadoes. Morgantown, Rochester, and Woodbury reflect Butler County’s overall history of tornado events, and therefore experiences moderate vulnerability as well.
Winter Storms in Butler County
Description
A winter storm is a combination of heavy snow, blowing snow, and/or dangerous wind chills; an ice storm produces at least 0.25 inches of glaze on exposed surfaces; snowfall occurs when ice crystals accumulate on surfaces at or below 32°F. These events create life-safety risks primarily through traffic crashes on icy roads, hypothermia exposure, and exertion while shoveling. The National Weather Service issues watches, warnings, outlooks, and advisories to communicate risk and expected severity.
What is a Severe Winter Storm?
The NOAA National Severe Storms Laboratory defines a winter storm as an event in which the main types of precipitation are snow, sleet or freezing rain.
Why can winter storms be so dangerous?
Most deaths from winter storms are not directly related to the storm itself.
- People die in traffic accidents on icy roads.
- People die of heart attacks while shoveling snow.
- People die of hypothermia from prolonged exposure to cold.
- Everyone is potentially at risk during winter storms. .
Types of Winter Storm Alerts:
Winter Storm Warning: Issued when a combination of hazardous winter weather in the form of heavy snow, heavy freezing rain, or heavy sleet is imminent or occurring. Winter Storm Warnings are usually issued 12 to 24 hours before the event is expected to begin.
Winter Storm Watch: Issued 12-48 hours in advance of the onset of severe winter conditions. The watch may or may not be upgraded to a winter storm warning, depending on how the weather system moves or how it is developing.
Winter Storm Outlook: Issued prior to a Winter Storm Watch. The Outlook is given when forecasters believe winter storm conditions are possible and are usually issued 3 to 5 days in advance of a winter storm.
Winter Weather Advisories: Issued for accumulations of snow, freezing rain, freezing drizzle, and sleet which will cause significant inconveniences and, if caution is not exercised, could lead to life-threatening situations.
Frost/Freeze Warning: Below freezing temperatures are expected and may cause significant damage to plants, crops, or fruit trees. People who have homes without heat need to take added precautions.
Extent
Extent is characterized by the number and severity of winter storm, heavy snow, and ice storm events (including federally declared disasters). The BRADD region recorded multiple FEMA winter-storm disaster declarations between 2000 and 2020 and 66 reportable winter storm events in that period.
Past Events & Location
From 2000–2020, Butler County experienced 5 severe winter storms.
Exposure is countywide (non-spatial at the planning scale), with impacts most evident where people, infrastructure, and travel corridors concentrate (e.g., Morgantown, Rochester, and Woodbury, and major roads)
Probability
Regionally, BRADD rates future winter-storm probability as moderate. Butler County’s observed history (5 events over 2000–2025) supports a similar, recurring likelihood at the county scale, with year-to-year variability driven by storm track and ice versus snow dominance.
Impact
Built Environment
Winter storms can damage roofs under snow load, break limbs that fall onto buildings and vehicles, down power lines, and block roads and bridges with snow/ice and debris; even modest icing can disrupt utilities and emergency response.
Natural Environment
Extended snow/ice cover can alter habitats and timing of species behavior; out-of-season events can injure or kill vegetation and damage crops and trees.
Social Environment
Hazardous travel, power outages, and isolation elevate risks for households—especially older adults or people with medical needs—while business closures and school disruptions impose community-wide costs.
Climate Change and Winter Storms
Changing winter characteristics: warmer winters overall, fewer heavy snowmelt events, more precipitation falling as rain/ice in the Southeast, a lengthening freeze-free season, and related economic and infrastructure stresses—factors that may shift Allen County’s winter risk mix toward icing events and infrastructure sensitivity even as extreme cold snaps still occur.
Vulnerability
The table below displays ice storm, winter storms, and heavy snow events that were reported to NOAA and NWS between 2000 and 2020. While not each of these events received a FEMA declaration, each showed clear characteristics
of a severe winter storm.
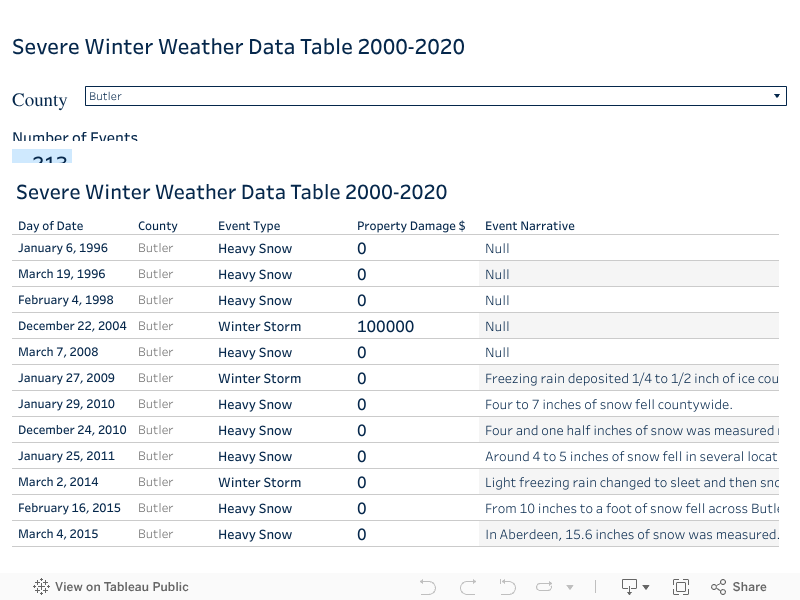
Vulnerability Summary Analysis
Between 2000 and 2020, NOAA and NWS reported 19 severe winter storms in Butler County.
On average, Butler County has experienced 6 winter storm events/21 years. This equates to a 0.29% chance of a winter storm event in Butler County annually.
In 2018, 1,200 customers were left without power as a result of ice accumulation on powerlines.
Because of these factors, Butler County experiences moderate vulnerability to winter storm events. Morgantown, Rochester, and Woodbury all reflect Butler County’s overall history of winter storms, and therefore experience moderate vulnerability as well.